
- Title
-
Dorsal activity of maternal squint is mediated by a non-coding function of the RNA
- Authors
- Lim, S., Kumari, P., Gilligan, P., Quach, H.N., Mathavan, S., and Sampath, K.
- Source
- Full text @ Development
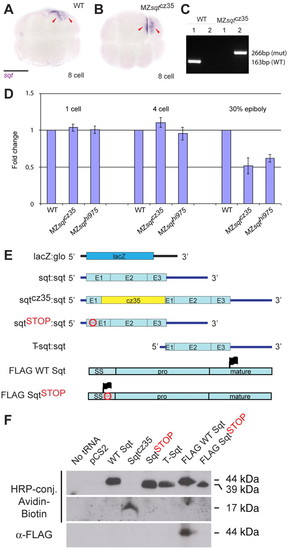
Mutant sqt RNAs are expressed and localized in MZsqt mutant zebrafish embryos. (A,B) Whole-mount in situ hybridization to detect localization of maternal sqt RNA (arrowheads) in 8-cell stage wild-type (WT) (A) and MZsqtcz35 mutant (B) embryos. (C) The genotype of wild-type (A) and MZsqtcz35 (B) embryos was confirmed by PCR to detect either wild-type (primer pair 1) or mutant sqt (primer pair 2) alleles. (D) Quantitative PCR to detect sqt RNA shows that maternal sqt transcript levels in MZsqt mutants are similar to those of wild-type embryos at the 1-cell and 4-cell stages, and that reduced sqt transcript levels are observed at gastrula stages in the mutant. Error bars indicate s.d. between three independent experiments. (E) Schematic of constructs to express lacZ, wild-type sqt (WT Sqt), sqtcz35 (Sqtcz35), sqt with a terminator codon in exon 1 (SqtSTOP), a 52 truncation of sqt (T-Sqt), and FLAG epitope-tagged wild-type sqt (FLAG WT Sqt) and sqtSTOP (FLAG SqtSTOP) in rabbit reticulocyte lysates (as shown in F). sqt coding sequences are in cyan (exons are indicated as E1-3), with the sqtcz35 insertion in yellow. Black line indicates globin 32UTR sequences and the blue line indicates the sqt UTRs. Red octagons indicate the position of the terminator codon in sqtSTOP and FLAG sqtSTOP and black flags mark the position of the FLAG epitope tags. SS, signal sequence. (F) In vitro translation to express Sqt proteins from the constructs described in E showing the expected 44 kDa wild-type Sqt protein, a C-terminus truncated 17 kDa Sqtcz35 peptide, and that both sqtSTOP and T-sqt produce the predicted 39 kDa protein from Met35. Scale bar: 100 μm. |
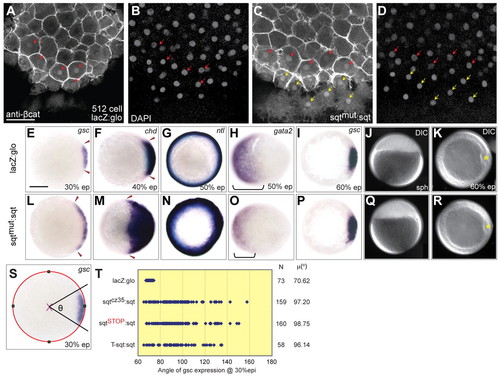
Mutant sqt RNAs expand the dorsal domain in early zebrafish embryos. (A-D) Embryos injected with capped lacZ:glo mRNA show β-catenin in nuclei of about five cells at the 512-cell stage (A,B), in comparison to mutant sqt RNA-injected embryos which show <11 β-catenin-positive nuclei (C,D). Red arrows indicate β-catenin-positive nuclei in the blastoderm, whereas yellow arrows show β-catenin-positive nuclei in the yolk syncytial layer (YSL). DAPI staining (B,D) shows all nuclei in blastoderm and YSL. (E-R) Normal expression of gsc (E), chd (F) and ntl (G) in lacZ:glo-injected embryos at 30% epiboly, 40% epiboly and 50% epiboly, respectively, as compared with expanded gsc (L), chd (M) and ntl (N) in mutant sqt:sqt UTR (sqtmut:sqt)-injected embryos. Expression domain of the ventral marker gata2 (brackets in H,O) is reduced in sqtmut:sqt RNA-injected embryos (O), in comparison to controls (H). At 60% epiboly, gsc expression is similar in lacZ:glo-injected (I) and mutant sqt:sqt-injected (P) embryos. Embryos injected with sqtmut:sqt RNA reach developmental landmarks such as sphere (J,Q) and 60% epiboly (K,R) at the same time as control-injected embryos (J,K). Red arrowheads (E,F,L,M) mark the extent of gsc and chd expression; yellow asterisks (K,R) mark the shield. (S) Schematic showing measurement of gsc angle (φ). The best-fit circle is indicated in red, green squares mark x and y coordinates, and the magenta ′X′ marks the center. (T) Angle of gsc expression in sqtmut:sqt RNA-injected or control lacZ-injected embryos at 30% epiboly. Each blue dot represents a single embryo. N indicates the number of injected embryos for each RNA and μ(°) shows the mean gsc angles. A-D, dorsal views; E-I,K-P,R,S, animal pole views with dorsal to the right; J,Q, lateral view. Scale bars: 25 μm in A; 100 μm in E. |

The sqt 3′UTR is necessary and sufficient for dorsal activity of sqt RNA. (A) Schematic of constructs used to express mutant sqt fused with globin 3′UTR (black; sqtSTOP:glo), sqt 32UTR (blue; sqtSTOP:sqt), venus (green) fused with globin 3′UTR (venus:glo) or sqt 3′UTR (venus:sqt). (B-I) Expression of gsc at 30% epiboly (B-E) is expanded in zebrafish embryos injected with sqtSTOP:sqt (C) or venus:sqt (E), but not with sqtSTOP:glo (B) or venus:glo (D). Dorsal expansion by the sqt 3′UTR is transient and is not detected at 60% epiboly (F-I). (J) Angle of gsc expansion in injected embryos at 30% epiboly. Each blue dot represents a single embryo. N indicates the number of injected embryos for each RNA and μ(°) shows mean gsc angles. Scale bar: 100 μm. |
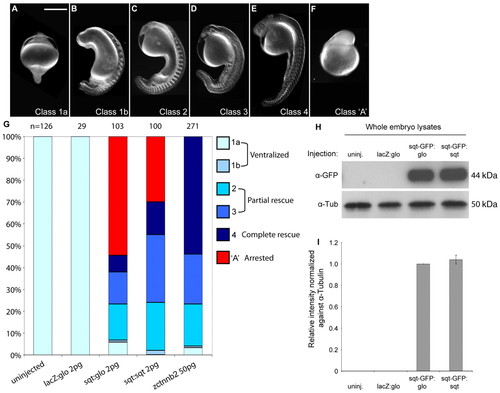
Rescue of ichabod embryos by Sqt is more effective with the sqt 3′UTR. (A-F) Uninjected and lacZ:glo RNA-injected ichabod (ich) embryos are completely radialized (class 1a; A), whereas sqt or zctnnb2 [zebrafish (z) beta catenin 2] RNA injection rescues anterior and dorsal structures to varying extents (class 1b-4; B-E), or causes early arrest (class ′A′; F). (G) Percentage embryos of each class. Injection of sqt:sqt and zctnnb2 RNA is more effective in rescuing ich embryos than sqt:glo. (H) Sqt-GFP protein (44 kDa) expressed from embryos injected with sqt-GFP:sqt or sqt-GFP:glo, and lysates from uninjected embryos and lacZ:glo-injected embryos as negative controls, are shown. Tubulin (50 kDa) provides a loading control. (I) Relative intensities of Sqt-GFP bands, normalized against Tubulin, show comparable translation efficiencies of sqt-GFP:sqt and sqt-GFP:glo in whole embryo lysates. Error bars indicate s.d. between two independent experiments. Scale bar: 100 μm. |

Dorsal activity of sqt RNA requires Wnt/β-catenin but not Nodal signaling. (A-O) Expression of gsc in dome stage MZoep zebrafish embryos (A-E) shows that, compared with lacZ:glo RNA (A,F,K), injection of sqtcz35:sqt (B,G,L), sqtSTOP:sqt (C,H,M), lacZ:sqt (D,I,N), or T-sqt:sqt (E,J,O) RNA expands the dorsal domain (B-E), similar to that in wild-type embryos (K-O). By contrast, ich embryos (F-J) show no/very sparse gsc expression for all injected RNAs. Arrowheads (A-E,K-O) mark the extent of gsc expression. A-O, animal pole views; A-E, K-O, dorsal to the right. (P) The angle of gsc in dome stage MZoep embryos after RNA injections. Each blue dot represents a single embryo. N indicates the number of injected embryos and μ(o) shows mean gsc angles. (Q) Percentage embryos that manifest gsc expression at 30% epiboly after sqt RNA injections in control or ich mutant embryos. Scale bar: 100 μm. |

Morpholinos targeting the sqt ATG disrupt sqt RNA localization. (A) The zebrafish sqt genomic locus (not to scale) indicating positions of the sqt ATG morpholino (MO1), sqt intron 2 morpholino (MO2), sqt DLE morpholino (DLE MO), sqt miR430 target protector morpholino (TPmiR430 MO), and target protector control morpholino (TPcontrol MO). Introns (I and II), exons (E1, E2 and E3; cyan boxes) and UTR (dark blue line) are indicated. The dorsal localization element is highlighted in green. (B-D) Embryos injected with sqt-GFP RNA show asymmetric expression of Sqt-GFP fluorescent protein in the blastoderm of 512-cell stage embryos (C), in comparison to uninjected embryos (B) and embryos co-injected with sqtMO1 and sqt-GFP that show Sqt-GFP fluorescence in the yolk (D). (E) Numbers (N) and percentage of embryos showing no expression, expression of Sqt-GFP in the blastoderm, yolk, or both. (F-I) Localization of injected fluorescent control lacZ or sqt:sqt RNA in 4-cell stage embryos co-injected with control morpholinos, sqtMO1, TPcontrol MO or DLE MO. (J) Percentage and number of embryos (top) showing sqt RNA localized (F,H), not localized (G), or as aggregates in the yolk (I). Lateral views at 512-cell stage (B-D) or 4-cell stage (H,I), or animal pole views at 4-cell stage (F,G). Scale bars: 100 μm. |

The sqt DLE MO and ATG MO differentially affect dorsal gene expression. (A-E) gsc expression expands upon injection of the DLE MO even at low doses, in comparison to injections of TPmiR430 MO or TPcontrol MO. (E) The percentage and number of embryos and the extent of gsc expression (classes I-IV, A-D) in injected embryos at sphere stages. (F-I) Expression of gsc is abolished in sqtMO1-injected embryos at the sphere stage (G), in comparison to control wild-type (F), MZsqt (H) or MZoep (I) embryos. (J-M) Expression of the ventral marker gene gata2 is expanded to varying extents in sqtMO1-injected embryos (K-M), in comparison to control embryos (J). (N-Q) Nuclear β-catenin (N,P) in dorsal cells is not detected in sqtMO1-injected embryos at the 512-cell stage (P,Q), in contrast to ConMO-injected embryos (arrows, N,O). DAPI staining (O,Q) shows the presence of nuclei. (A-D,F-M) Animal pole views; (N-Q) dorsal views. Scale bars: 100 μm in A; 25 μm in N. |
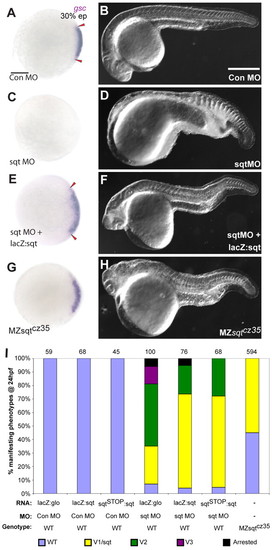
Loss of dorsal specification due to sqt morpholinos is rescued by the sqt 3′UTR. (A-H) Early gsc expression is not detected in sqtMO-injected (C), in contrast to ConMO-injected (A), zebrafish embryos. Expression of gsc is rescued in sqt morphants by co-injection of lacZ:sqt (E), but not with lacZ:glo (see supplementary material Fig. S4). Embryos co-injected with sqtMO and lacZ:sqt (F,I) or sqtMO and sqtSTOP:sqt (I) are rescued partially and are similar to MZsqtcz35 mutant embryos (H). Images in F,H were acquired in different focal planes for the rostral and caudal regions of the embryo and subsequently assembled. (A,C,E,G) 30% epiboly, animal pole views with dorsal to the right; (B,D,F,H) prim-5 stage. Arrowheads (A,E) mark the extent of gsc expression. (I) Extent of rescue of sqtMO-injected embryos by co-injection of lacZ:sqt or sqtSTOP:sqt, versus control lacZ:glo RNA. Scale bars: 100 μm. |
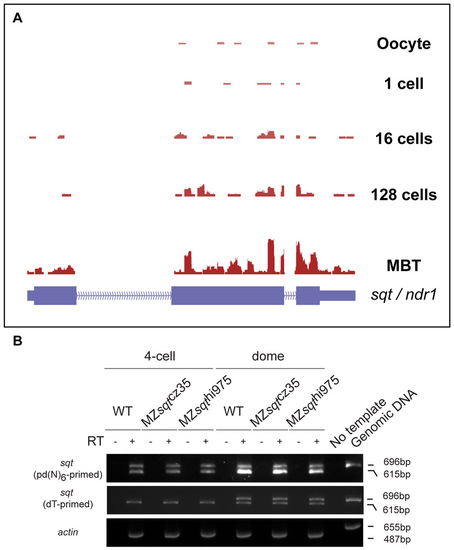
RNA sequencing in early embryos shows non-polyadenylated maternal squint RNA. RNA sequencing of transcripts shows that sqt RNA is not polyadenylated in oocytes and 1-cell embryos, and becomes polyadenylated during early development. (A) RNA sequencing, data normalization, mapping and data analysis are as described previously (Aanes et al., 2011). RNA-seq tags obtained from SOLiD3 sequencing of whole transcriptome libraries from oocytes, 1-cell embryos, 16-cell embryos, 128-cell embryos and 1000-cell (MBT) stage embryos were mapped to Reference Genome assemblies and gene annotation (RefSeq) (UCSC browser Zv9 assembly; danRer7) using Whole Transcriptome Analysis Pipeline version 1.2 (WTAP 1.2) and Bioscope (Applied Biosystems). Tags mapping to all the known RefSeq genes were counted and the mapping was visualized using the browser. Schematic of the sqt (ndr1) locus is shown in blue. (B) RT-PCR using pd(N)6-primed cDNAs (top panel) or oligo(dT)-primed cDNA (middle panel) to detect sqt RNA in 4-cell and dome stage wild-type, MZsqtcz35 and MZsqthi975 embryos. PCR using pd(N)6-primed cDNA shows unspliced (696 bp) and spliced (615 bp) sqt RNA. Spliced sqt product is detected in oligo(dT)-primed cDNA at early stages, and no PCR product is detected in RT and no template controls. actin RT-PCR (bottom panel) and genomic DNA PCR were used as positive controls. |
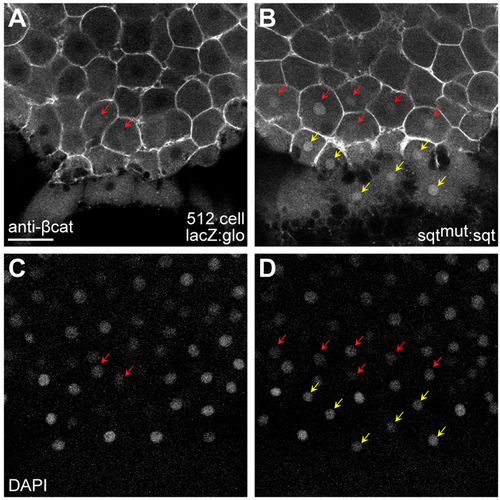
β-catenin expression in the dorsal YSL. (A-D) YSL expression of β-catenin is not detected in 512-cell stage embryos injected with capped lacZ:glo mRNA (A,C), in comparison to mutant sqt RNA-injected embryos which show several β-catenin-positive nuclei in the YSL (yellow arrows in B,D). DAPI staining (C,D) shows all nuclei in blastoderm (red arrows) and YSL. Scale bar: 25 μm. |
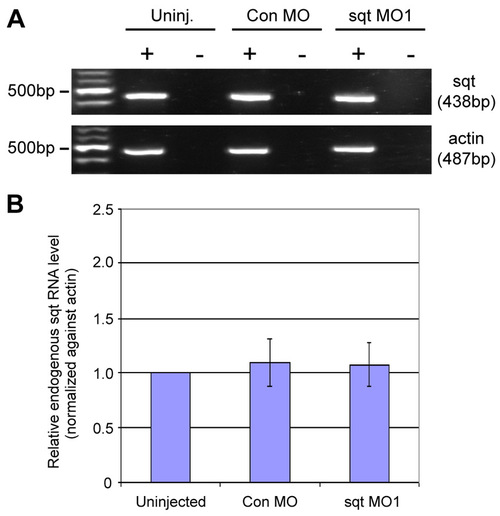
sqtMO1 does not affect the stability of sqt RNA. (A) Semi-quantitative RT-PCR analysis of endogenous sqt RNA in uninjected, Con MO-injected or sqtMO1-injected embryos at the 8-cell stage shows that sqt RNA levels remain uniform. (B) Quantitative real-time RT-PCR to detect endogenous sqt RNA in uninjected embryos, embryos injected with Con MO and embryos injected with sqtMO1 shows that sqt RNA levels remain unchanged at least until the 8-cell stage. Bar chart shows the relative expression of sqt RNA, normalized against actin RNA levels. The experiment was performed three times; error bars indicate the s.d. between independent experiments. |

Mutant sqt RNA rescues early dorsal gene expression in sqt morphant embryos. Co-injection of sqtSTOP:sqt or lacZ:sqt RNA with sqtMO1 or sqtMO2 can rescue the loss of early gsc expression in sqt morphant embryos, in contrast to co-injection of lacZ:glo RNA with the sqt morpholinos. (A-D) Classification of gsc expression in injected embryos. Red arrowheads indicate the extent of gsc expression in the injected embryos. Animal pole views, dorsal to the right. (E) Histogram showing percentage embryos with dorsal gsc expression upon co-injection of sqt morpholinos with lacZ:glo, lacZ:sqt or sqtSTOP:sqt RNA. The number of embryos for each injection is shown at the top. Scale bar: 100 μm. |

Dorsal expansion by sqt UTR is not mediated via miRNAs. (A) Model showing localization of sqt RNA (green) in 1-cell and 4-cell embryos, and expansion of the dorsal gsc expression domain (purple arc) upon injection of mutant sqt RNA (magenta). Yellow asterisks indicate presumed negative regulators (for e.g. miRNAs) bound by the sqt UTR. The model proposes that if the sqt UTR binds miRNAs that negatively regulate dorsal determinants, overexpressed mutant sqt RNA could act as a sink that binds to the miRNAs, allowing a larger zone of dorsal, and sqt 32UTR with mutations in these target sites should not expand dorsal. (B) Schematic showing predicted target sites (http://www.mirbase.org and http://www.ebi.ac.uk/enright-srv/microcosm/htdocs/targets/v5) for miR-430 (magenta bar), miR-19a* (purple bar) and miR-152 (orange bar) in the sqt UTR (blue line). Mutations in miRNA target sites are indicated with asterisks. (C) Schematic showing the venus reporter (green box) fused to either globin UTR (v:glo), sqt UTR (v:sqt), or sqt UTR with the miRNA target site mutations illustrated in B (v:sqtmm430, v:sqtmm19a* and v:sqtmm152). (D-H) Expression of gsc at 30% epiboly (D-H) still expands upon injection of v:sqtmm430, v:sqtmm19a* and v:sqtmm152 (E-H), similar to injection of v:sqt. (I-M) Expression of Venus protein at 24 hours shows the efficacy of the miRNA target site mutations. Venus expression is barely detected in v:sqt-injected embryos (J), in comparison to v:glo (I), v:sqtmm430 (K), v:sqtmm19a* (L) and v:sqtmm152 (M) injected embryos. (N-P) MZdicer embryos injected with lacZ:sqt (O) and sqtSTOP:sqt (P) RNA show expanded dorsal gsc in comparison to MZdicer embryos injected with lacZ:glo RNA (N). Therefore, dorsal activity of sqt 32UTR is not mediated via the miRNAs tested or dicer. (Q,R) The angle of gsc expression in injected embryos at 30% epiboly. Each blue dot represents a single embryo. N indicates number of injected embryos and μ(°) is the mean angle of gsc. (D-H,N-P) Animal pole views with dorsal to the right; (I-M) lateral views, dorsal to the right, anterior to the top. Red arrowheads (D-H,N-P) mark the extent of gsc expression. Scale bars: 100 μm. |