
- Title
-
Chemokine and Fgf signalling act as opposing guidance cues in formation of the lateral line primordium
- Authors
- Breau, M.A., Wilson, D., Wilkinson, D.G., and Xu, Q.
- Source
- Full text @ Development
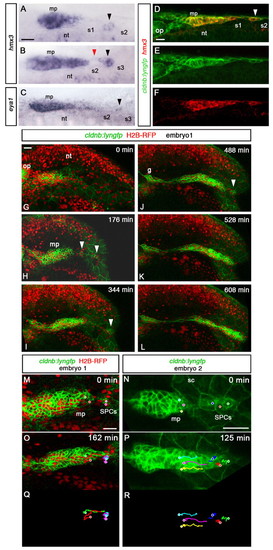
SPCs have placode identity and fuse with the main primordium. All images are lateral views, anterior to the left, except A-F which show dorsal views. (A,B) hmx3 expression in the primordium at 22-24s. Black arrowheads indicate SPCs; the red arrowhead indicates fusion between SPCs and main primordium. (C) eya1 expression in SPCs (black arrowhead) at 20s. (D-F) Fluorescence detection of hmx3 mRNA (red) in cldnb:lyngfp (green) embryos at 20s. White arrowhead indicates SPCs. (G-L) Images from time-lapse microscopy performed from 18s on a cldnb:lyngfp embryo injected with H2B-RFP mRNA (supplementary material Movie 1). White arrowheads indicate SPCs. (M-R) Tracking of SPCs and primordium tip cells in embryo 1 (supplementary material Movie 1) and embryo 2 (supplementary material Movie 2) before the fusion. Dots in M and N indicate initial positions of tracked cells. O-R show final time points. g, posterior lateral line ganglion; mp, main primordium; nt, neural tube; op, otic placode; s, somite, sc, skin cells. Scale bars: 25 μm. |
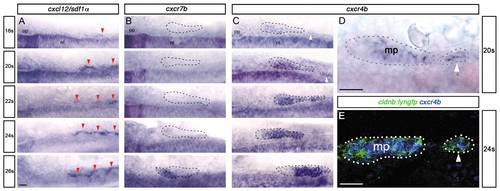
SPCs express Cxcr4b, but not Cxcr7b. (A-C) Time course of cxcl12/sdf1α (A), cxcr7b (B) and cxcr4b (C) expression at 18s-26s. Red arrowheads indicate sdf1α expression in somites; white arrowheads indicate cxcr4b expression in SPCs. The main primordium (18 and 20s) and primordium fused with SPCs (22 to 26s) are outlined with dashed lines. (D,E) High magnification views of cxcr4b expression at 20s (D) and cxcr4b (blue) in cldnb:lyngfp embryos (green) at 24s (E). Main primordium (mp) and SPCs are outlined. Scale bars: 25 μm. |

Cxcr4b attracts SPCs caudally. (A) hmx3 expression at 24s in control and ody–/– embryos. Black arrowheads indicate SPCs. (B) SPC frequency analysed by hmx3 expression in ody–/– and stage-matched controls at 24s. *P=0.013. Error bars indicate s.e.m. (C-J) Tracking of the SPCs and primordium tip cells in two ody–/– embryos (supplementary material Movie 5). In C and D, dots show initial positions of tracked cells. E and F show intermediate time points and G-J show final time points. Scale bars: 25 μm. |
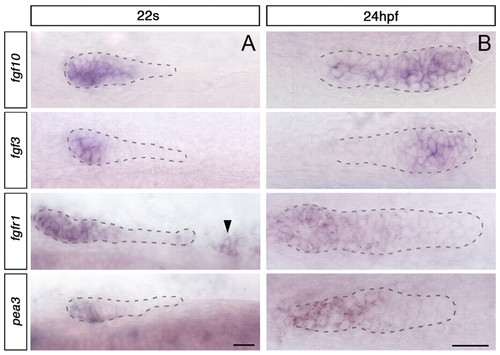
Expression pattern of Fgf signalling components before and after the fusion. (A) Expression of Fgf signalling components at 22s, before fusion. Main primordium is outlined with dashed lines; the black arrowhead indicates SPCs. Dorsal view. (B) Expression of Fgf components at 24 hpf, after fusion. The primordium fused with SPCs is outlined with dashed lines. Side view. Scale bar: 25 μm. |

Fgf signalling attracts SPCs towards the primordium. (A) SPC frequency in hsp70:dn-fgfr1 embryos, heat-shocked at 16s and fixed at 24s, compared with heat-shocked siblings. **P=0.008. (B) Average distances covered by the tip of the main primordium (red) and SPCs (blue) in hsp70:dn-fgfr1 embryos (n=94) and control siblings (n=87) at 24s. See also supplementary material Fig. S3 and Materials and methods. *P=0.034, ns, non significant (P=0.13). (C) Tracking of SPCs and primordium tip cells in two SU5402-treated embryos (supplementary material Movie 6). Dots show initial positions of tracked cells in a and b. c and d show intermediate time points and e-h show final time points. (D) SPC frequency in embryos injected with control or Cxcr4b morpholinos in hsp70:dn-fgfr1 embryos and heat-shocked siblings. Embryos were heat-shocked at 16s and fixed at 24s. *P<0.05, **P<0.01 (ANOVA followed by Tukey’s test). Error bars represent s.e.m. |
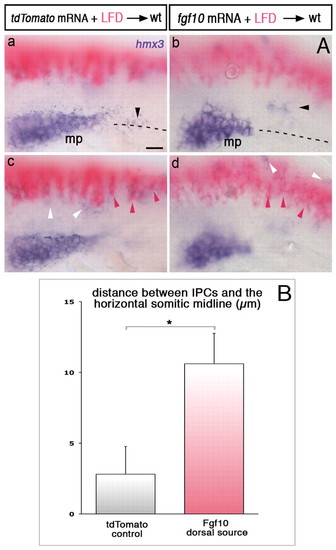
Ectopic sources of Fgf10 attract SPCs. (A) hmx3 expression (purple) in embryos transplanted with Fgf10- or tdTomato-expressing cells (pink). Black, pink and white arrowheads show SPCs, transplanted cells and hmx3-expressing spinal cord neurons, respectively. Dashed lines represent the somitic midlines. z-focus made on the primordium and SPCs (a,b) and on the transplanted cells in the dorsal neural tube (c,d). (B) Distance between SPCs and the horizontal somitic midline in embryos with transplanted cells expressing Fgf10 (n=46) or tdTomato (n=38) dorsal to the primordium region. *P=0.010. See also supplementary material Fig. S3 and Materials and methods. Error bars represent s.e.m. Scale bars: 25 μm. |
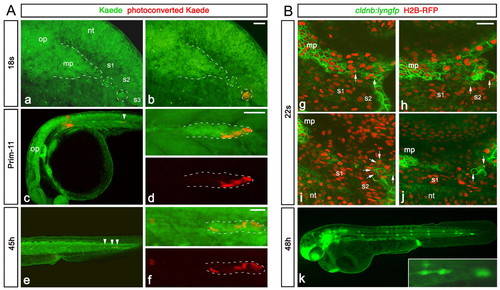
Progeny of SPCs contributes to the terminal neuromasts. (Aa,Ab) Primordium region of 18s embryo injected with Kaede mRNA, before (a) and after (b) photoactivation in the most caudal SPC cluster. The main primordium and SPCs are outlined with dashed lines. (Ac) Low magnification of the same embryo at prim-11, showing red cells (white arrowhead) in the migrating primordium. No deposited red cell is observed between the region of activation (red arrowhead) and the primordium. (Ad) High magnification of the primordium shown in c, showing red cells in the leading part of the primordium. (Ae) Low magnification of the trunk at 45h, showing red cells (white arrowheads) in the last deposited neuromast and in the primordium reaching the tail. No red cell is deposited more anteriorly. (Af) High magnification of the primordium and the terminal neuromast shown in e. See also supplementary material Fig. S4. (Bg-Bj) Examples of confocal sections showing the primordium region of cldnb:lyngfp embryos at 22s, 2 hours after partial laser ablation of SPCs. H2B-RFP-labelled fragmented DNA of dying SPCs is indicated by white arrows. (Bk) Phenotype observed at 48h in embryos in which a subset of SPCs were laser-ablated on the left side. The primordium is small and unable to complete its journey, compared with the control non-ablated side. The inset shows a high magnification of the arrested primordium. mp, main primordium; nt, neural tube; op, otic placode; s, somite. Scale bars: 25 μm. |
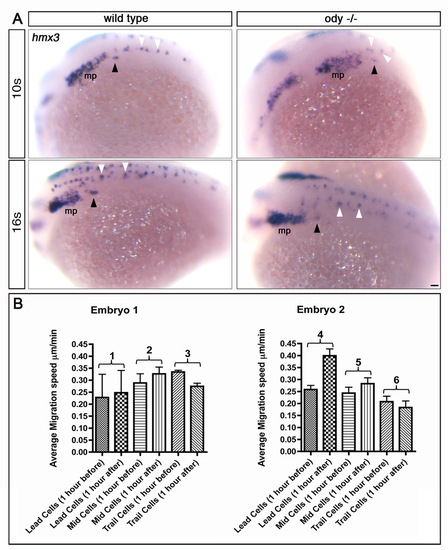
Increased migration of the primorduim after fusion with SPCs. (A) Detection of SPCs from the 10s stage. Whole-mount hmx3 in situ hybridisation at 10s and 16s in wild-type and ody-/- embryos. Anterior to the left. Black arrowheads indicate SPCs. White arrowheads show hmx3-expressing spinal cord neurons. mp, main primordium placode. Scale bar: 25 µm. (B) Cell tracking of the primordium before and after the fusion. Average speed of leading, mid and trailing primordium cells during 1 hour period before and after the fusion between SPCs and the main primordium. P values: 1=0.018, 2=0.028, 3=0.015, 4=0.0001, 5=0.040 and 6=0.258. |
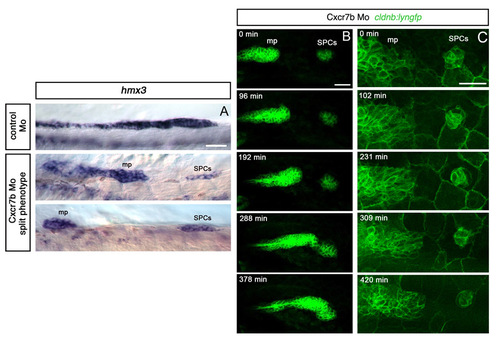
Failure of fusion in Cxcr7b morphants reveals the dynamic behaviour of SPCs. (A) hmx3 expression at 28 hpf, showing the split phenotype observed in 10% of Cxcr7b Mo-injected embryos. (B) Images from a time-lapse sequence performed from 26s on a cldnb:lyngfp embryo injected with Cxcr7b Mo, showing changes in the shape of the SPC cluster and their protrusive activity in all directions. The migration of the main primordium is delayed but it eventually catches up the SPC cluster (supplementary material Movie 3). (C) Images from a time-lapse performed from 20s onward on another Cxcr7b morphant (supplementary material Movie 4). In both movies, no net forward or backward migration of the SPCs is observed. Scale bars: 25 μm. |
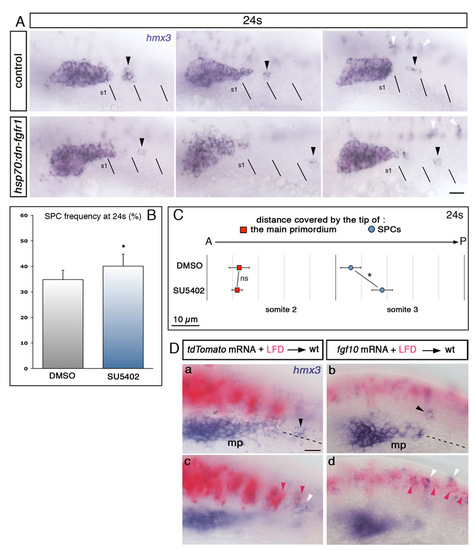
Fgf signalling attracts SPCs towards the primordium. Side view and anterior to the left. (A) hmx3 expression in heat-shocked hsp70:dn-fgfr1 embryos and control siblings. The position of SPCs, indicated by black arrowheads, is shifted caudally in hsp70:dn-fgfr1 embryos. Black lines indicate somitic borders. White arrowheads indicate hmx3-expressing spinal cord neurons. (B) SPC frequency at 24s in DMSO- and SU5402-treated embryos. *P=0.018. (C) Average distances covered by the tip of the main primordium (red) and SPCs (blue) in SU5402-treated embryos (n=49) and DMSO controls (n=34) at 24s. *P=0.041, ns, non significant (P=0.85). (D) Additional examples of hmx3 expression (purple) in embryos transplanted with Fgf10- or tdTomato-expressing cells (pink). Black, pink and white arrowheads show SPCs, transplanted cells, and hmx3-expressing spinal cord neurons, respectively. Dashed lines represent the horizontal somitic midlines. Focal planes focused on the primordium and SPCs (a,b) or on the transplanted cells in the neural tube (c,d). mp, main primodium; S, somite. Scale bars: 25 μm. |
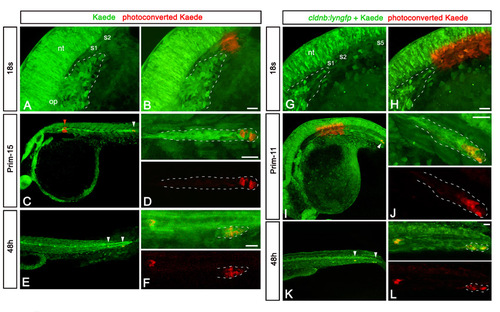
Additional examples of the fate-mapping of SPC. (A,B) Primordium region of 18s embryo injected with Kaede mRNA, before (A) and just after (B) photoactivation of Kaede in a small circular region including putative SPCs. The main primordium is outlined with white dashed lines. (C,D) Low (C) and high (D) magnification of the same embryo at the prim-15 stage, showing red cells (white arrowhead) in the leading zone of the migrating primordium. No deposited red cells are observed between the region of activation (red arrowhead) and the primordium. (E,F) Low (E) and high (F) magnification of the same embryo at 48h, showing the presence of red cells (white arrowheads) in the last deposited neuromast and in the primordium that has reached the tail region. No deposited red cells are detected more anteriorly. (G,H) Primordium region of 18s embryo injected with Kaede mRNA, before (G) and just after (H) photoactivation of Kaede in a region containing all potential SPCs, including half of somite 1 to somite 5. The main body of the primordium is outlined with white dashed lines. (I,J) Low (I) and high (J) magnification of the same embryo at the prim-11 stage, showing red cells (white arrowhead) scattered in the leading zone of the migrating primordium. No deposited red cell can be observed between the region of activation and the primordium. (K,L) Low (K) and high (L) magnification view of the same embryo at 48h, showing a large contribution of red cells (white arrowheads) to the three posterior-most neuromasts. No deposited red cells are detected more anteriorly. nt, neural tube; op, otic placode; S, somite. Scale bars: 25 μm. |