
- Title
-
Crb Apical Polarity Proteins Maintain Zebrafish Retinal Cone Mosaics via Intercellular Binding of Their Extracellular Domains
- Authors
- Zou, J., Wang, X., and Wei, X.
- Source
- Full text @ Dev. Cell
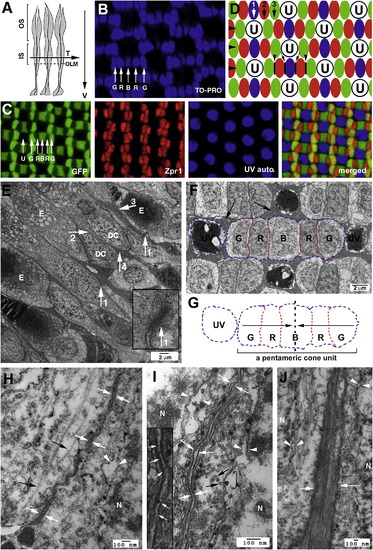
Cones Are Organized in Regular Mosaics in the Zebrafish Retina, and Their Inner Segment Cell Membranes Are Closely Juxtaposed (A) A schematic illustrates the transverse/tangential (arrow T) and vertical (arrow V) section planes of photoreceptors (gray). The outer limiting membrane (OLM; dashed line); inner segments (IS); outer segments (OS). (B) TO-PRO nuclear staining illustrates the geometric alignments of the cell nuclei of green (G), red (R), and blue (B) cones. (C) Confocal images of four types of cones in wild-type Tg(RH2-1:GFP) pt112 adult zebrafish (Zou et al., 2010), which express GFP strongly in green (G) and blue (B) cones and weakly in red (R) cones. Double cones (red) were visualized with zpr1 antibodies. UV cones (blue) were visualized by autofluorescence signals. (D) A schematic illustrates the orthogonal planar arrangements of rows (large arrowheads) and columns of cones (arrows 1, 2, and 3). The junctional interfaces (small arrowheads) between the members of double cones are parallel to the axes of cone columns. The junctional interfaces between red and blue cones are indicated with black lines and small arrows. The letter U stands for UV cones; green, red, and blue cones are color-coded in green, red, and blue, respectively. (E) Transmission electron microscopic (TEM) imaging of the inner segment vicinity of a vertically sectioned adult retina revealed the neatly aligned OLM (arrow 1s), direct juxtaposition between double cone (DC) members (arrow 2), and the bundles of long (arrow 3) and short (arrow 4) apical Müller cell processes. The ellipsoids are indicated with the letter E. The inset shows an OLM junction at a higher magnification. (F) TEM imaging of a tangentially sectioned wild-type adult retina revealed the flat junctional interfaces (red dashed lines) between members of a pentameric cone unit, which contains a blue cone (B) and two pairs of double cones (R, for red cones; G for green cones). UV cones, surrounded by clusters of Müller cell apical processes and the inner segments of rods (arrows), are round and do not establish any flat junctional interfaces with other cone types at the level of inner segments. The blue contour lines indicate the convex cell membrane regions of the cones. (G) The contours of a UV cone and a pentameric cone unit in (F) are duplicated here to better illustrate the overall shape of cones at cross sections. The dashed line and arrows illustrate the mirror-symmetrical alignment of the cone members within a pentameric cone unit. (H and I) TEM imaging of the junctions between the members of double cones (opposing white arrows), either sectioned vertically (H) or transversly (I). The inset at a higher magnification shows the fine filaments (arrows) that connect the neighboring cell membranes. (J) Müller cell apical processes are tightly bundled together (opposing white arrows). N, cell nuclei; black arrows, microtubules (H, I, and J). EXPRESSION / LABELING:
|
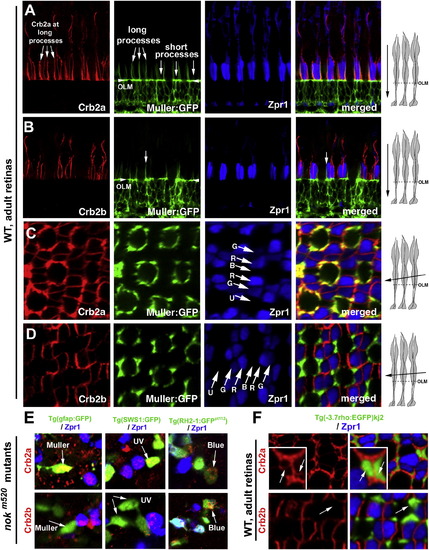
Crb2a Is Expressed in All Types of Photoreceptors and Müller Cells, whereas Crb2b Is Predominantly Expressed in Green, Red, and Blue Cones (A and B) Vertical imaging of the photoreceptor layer showed that Crb2a localizes to inner segment interfaces between photoreceptors and to the apical processes of Müller cells, which were highlighted by GFP expression in the Tg(gfap:GFP)mi2001 background (Bernardos and Raymond, 2006). By contrast, Crb2b localizes predominately at the junctional interfaces between the green, red, and blue cone inner segments but not to the Müller cell apical processes. The long and short Müller cell apical processes are indicated with arrows. The arrowheads indicate the OLM. (C and D) Slightly tilted tangential imaging of the photoreceptor layer revealed broader Crb2a expression and more restricted Crb2b localization to the junctional regions between green, red, and blue cones. Lettered arrows in (C) and (D) indicate UV (U), green (G), red (R), and blue (B) cones. The drawings on the right illustrate the planes of imaging (solid arrows) relative to the orientations of photoreceptors. (E) Unlike Crb2a, Crb2b was not detected in Müller cells (left panels, arrows) or UV cones (middle panels, arrows) in 5-dpf nokm520 mutant retinas. However, both Crb2a and Crb2b were detected in blue cones (right panels, arrow, GFP-positive and Zpr1-negative) and double cones (Zpr1-positive cells). The backgrounds of various transgenic fish used here are indicated above the panels. (F) In wild-type adult rod:GFP fish, Crb2a but not Crb2b was detected at the inner segments of rods (green). See also Figures S1 and S2. EXPRESSION / LABELING:
|
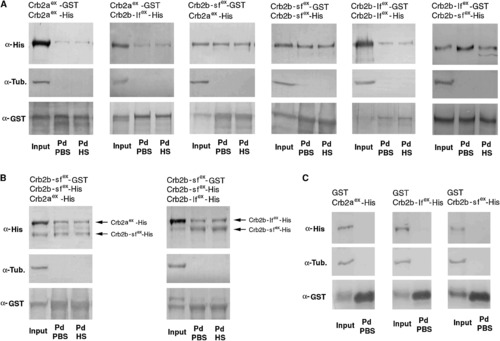
The Extracellular Domains of Crb2a, Crb2b-lf, and Crb2b-sf Mediate Homophilic and Heterophilic Physical Adhesion Various combinations (indicated above the blots) of GST and His fusions of the extracellular domains of Crb2a, Crb2b-lf, and Crb2b-sf were coexpressed in sf9 cells. The cell lysates were analyzed by GST pull-down and western blotting assays. Anti-GST blots confirmed the efficient pull down of GST fusion proteins. Anti-α-tubulin blotting indicated the absence of cytoplasmic protein contamination in the pull-down fractions (Pd). The pull-down fractions were washed either with PBS (PBS) only or with PBS as well as 1 M NaCl high-salt solution (HS). (A) Pull-down analyses of pairwise and coexpressed GST- and His-fusions indicated that the extracellular domain of Crb2a, Crb2b-lf, and Crb2b-sf physically adhered to each other both homo- and heterophilically. In addition, the adhesion was strong enough to withstand high ionic washes. (B) Competition pull-down analyses revealed that Crb2b-sfex-GST bound to Crb2b-sfex-His more efficiently than it bound to Crb2b-lfex-His or Crb2aex-His, as suggested by the higher ratios between Crb2b-sfex-His and its Crb2b-lfex-His or Crb2aex-His competitors in the pull-down fractions than in the input fractions. (C) As specificity controls, when coexpressed with Crb2aex-His, Crb2b-lfex-His, or Crb2b-sfex-His, GST itself did not pull down any Crb-His fusions, indicating that these His-fusions did not bind to GST or glutathione resin nonspecifically. |
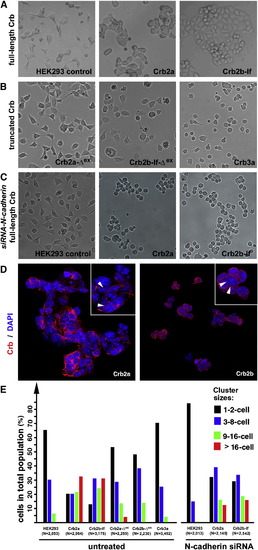
The Extracellular Domains of Crb2a- or Crb2b-lf-Mediated Cell Aggregation in HEK Cells (A) Unlike wild-type HEK cells, it is more common for monoclonal HEK cells that express full-length Crb2a or Crb2b-lf to grow in large aggregates. (B) Expression of Crb3a, Crb2a-Δex, and Crb2b-Δex, which lack typical Crb extracellular domains, did not prompt HEK cell aggregation. (C) Suppression of N-cadherin by N-cadherin siRNA treatment further reduced the tendency for wild-type HEK cells to form aggregates, suggesting that the low-level cell-cell adhesion in wild-type HEK cells was dependent on N-cadherin. However, loss of N-cadherin did not prevent Crb2a- or Crb2b-lf-expressing HEK cells from aggregating, suggesting that the Crb2-mediated cell-cell adhesion was independent of N-cadherin. (D) Crb2a and Crb2b-lf localized to the cell membrane in HEK cells with various degrees of enrichment at the cell-cell junctions (arrowheads, insets). The cell nuclei were stained with DAPI (blue). (E) To quantitatively evaluate the adhesion property of the extracellular domain of Crb proteins, various Crb-expressing HEK cells were counted and categorized according to their cluster sizes. The total numbers of cells are indicated below the histograms. The symbol Δex indicates that the extracellular domain of the corresponding Crb protein was deleted (Figure 6A). See also Figure S3. |
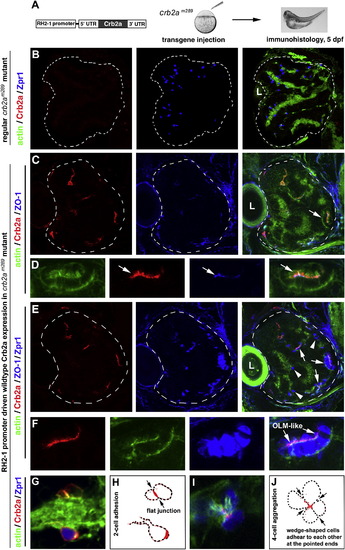
Transgenic Expression of Wild-Type Crb2a in crb2am289 Mutants Led to Photoreceptor Aggregation (A) A schematic illustrates the structure of the transgene construct that was injected into embryos at 1-4-cell stages to express wild-type Crb2a with the RH2-1 green opsin promoter in photoreceptors (Tsujimura et al., 2007). It should be noted that the number of transgenic photoreceptors varies from embryo to embryo because of varying efficiencies of transgenesis in the injected fish. (B) In regular crb2am289 mutant retinas, Zpr1-positive cones (blue) scatter everywhere in the retina; note the lack of Crb2a signals (red). (C and D) Retinal cells that transgenically expressed wild-type Crb2a (red) tended to form aggregates. The OLM-like structures, visualized by the OLM marker ZO-1 (arrows), were present in the aggregates. Actin staining (green) illustrated the overall structure of the retina as well as the OLM-like structures (D, arrows). (D) shows a cell aggregate in (C) (arrow) at a higher magnification. (E and F) The identical tissue section showed in (C) and (D) was subsequently immunostained with zpr1 antibodies; this confirmed that the aggregating cells were mostly double cones (F, higher magnification). (G and H) Two Crb2a-expressing transgenic cells established a flat junctional interface, which was highly enriched with Crb2a (arrows). (H) shows the contours of transgenic cells in (G). (I and J) Four wedge-shaped transgenic double cones adhered to each other to form a mini rosette, and Crb2a localized to the central region of the rosette (arrows). (J) shows the contours of transgenic cells in (I). Dashed lines in (B, C, and E) mark the boundary of the retinas, and the letters L indicate the lens. See also Figure S4. |
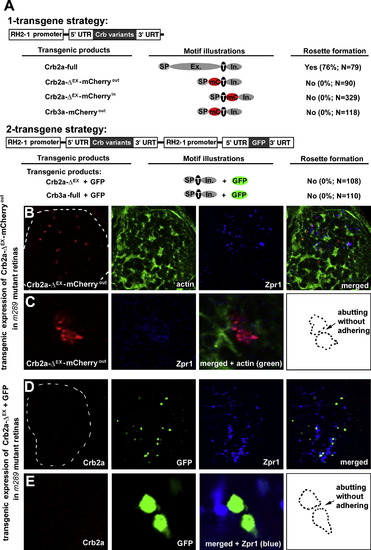
The Extracellular Domain of Crb2a Is Required for Crb2a to Mediate Photoreceptor Adhesion (A) The schematics illustrate the two strategies to transgenically express Crb2a, Crb2a-ΔEX-mCherryout, Crb2a-ΔEX-mCherryin, Crb2a-ΔEX, Crb3a-mCherryout, or Crb3a in zebrafish retina. Individual protein domains are labeled as follows: SP, the signal peptide; Ex., the extracellular domain; T, the transmembrane domain; In., the intracellular domain; mC, mCherry; GFP, green florescent protein; -ΔEX, absence of the extracellular domain. The percentages of transgenic photoreceptors that formed rosettes in 5-dpf crb2am289 mutant retinas were quantified and summarized in the table. (B and C) Crb2a-ΔEX-mCherryout-expressing photoreceptors (red) scattered randomly in the crb2am289 mutant retinas. (C) shows magnified images of two transgenic cells that abutted each other but did not appear to adhere (the contours illustrates the lack of a flat-adhering junctional interface, arrow). (D and E) Transgenic photoreceptors that coexpressed Crb2a-ΔEX and GFP also scattered randomly in the crb2am289 mutant retinas. (E) shows magnified images of three transgenic cells, two of which abutted but did not adhere to each other to establish a flat junctional interface (contours, arrow). The lack of Crb2a staining confirmed that the embryo was a crb2am289 mutant. See Figure S5 for effects of transgenic expressing Crb2a-ΔEX-mCherryin, Crb3a-mCherryout, and Crb3a in either wild-type or crb2am289 mutant embryos. |
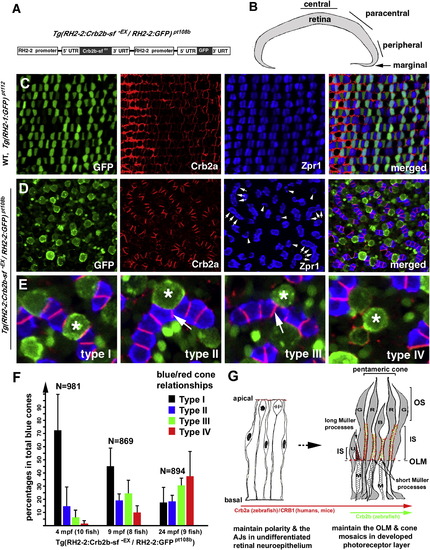
Transgenic Expression of a Secreted Form of the Extracellular Domain of Crb2b-sf (Crb2b-sf-EX) Disrupts Cone Mosaics (A) A schematic illustrates the tandem arrangement of the Crb2b-sf-EX and GFP transgenes driven by the RH2-2 green opsin promoter (Tsujimura et al., 2007). (B) The central, paracentral, peripheral, and marginal regions of the retina are indicated. (C) Photoreceptors are organized in regular mosaic in the paracentral retina of wild-type Tg(RH2-1:GFP) pt112 fish (Zou et al., 2010) at 24 months postfertilization (mpf). (D) Transgenic expression of Crb2b-sf-EX in blue cones disrupted photoreceptor mosaics in the paracentral retina in Tg(RH2-2:Crb2b-sf-EX/RH2-2:GFP)pt108b at 24 mpf. Some double cones were dissociated into solitary Zpr1-positive cells (arrowheads); other double cones abnormally aligned into chains (arrows). (E) In Tg(RH2-2:Crb2b-sf-EX/RH2-2:GFP)pt108b, blue cones (asterisks) were found in four different spatial relationships with red cones: type I, sandwiched between red cones; type II, partially expelled from the red cone sandwich; type III, completely expelled from the red cone sandwich but still attached to the side of the red cones; type IV, solitary without adhering to any Zpr1-positive cones. The arrows indicate the de novo junctions formed between two presumable red cones. (F) Blue cone-secreted Crb2b-sf-EX gradually compromised the association between blue and red cones, resulting in an increase in the percentages of dissociated blue cones over time. Error bars = SD. (G) A diagram summarizes the temporal and spatial expression patterns and functions of Crb proteins during the vertebrate retinal development. Zebrafish Crb2a and its mammalian equivalent CRB1 are broadly expressed and regulate the polarity and integrity of both the undifferentiated neuroepithelium and the developed photoreceptor layer. Crb2b homologs are likely more restrictively expressed in certain types of photoreceptors in a subgroup of vertebrates, such as fish. The restricted expression of Crb2b at the inner segments between green (G), red (R), and blue (B) cones may underlie their structural assembly into pentameric cones in zebrafish; consequently, Crb2b plays a critical role in maintaining cone mosaics. The long apical processes of Müller cells (M) cluster around the UV cones (U), likely preventing them from adhering to pentameric cones. The apical processes of Müller cells between the members of pentameric cones are very short and are thus no impediment to their inner segment associations. See also Figure S6. |
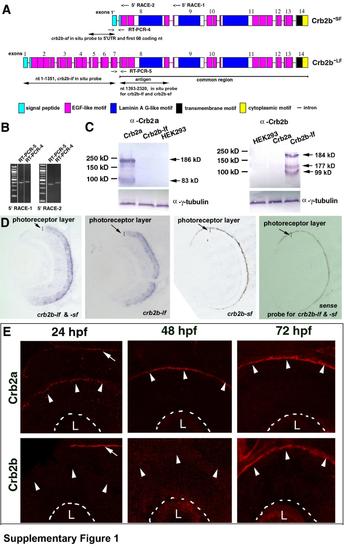
Cloning and expression pattern analyses of the crb2a and crb2b genes in developing zebrafish retina, related to Figure 2. A. A schematic shows the exon-intron structural differences between crb2b-lf and crb2b-sf (not to scale). The exons are numbered from the 5′ end to the 3′ end. Primer binding sites for two 5′RACE reactions are indicated at the top of the chart. The regions amplified by RT-PCR reactions 4 and 5 are indicated with opposing arrows. The common region of the crb2b-lf and crb2b-sf transcripts is underlined. The antigenic region for making anti-Crb2b-lf amino acids 466-773 antibodies and the regions that the in situ probes bind to are indicated with double-headed arrows. B. The similar expression levels of crb2b-sf and crb2b-lf was confirmed by RT-PCR reactions 4 and 5, which used two different sets of cDNA prepared from 5′RACE-1 and 5′RACE-2. C. The specificity of the anti-Crb2a and anti-Crb2b antibodies was verified by Western blotting analyses of the lysates of Crb2a-, and Crb2b-lf-expressing HEK293 cells. The predicted molecular weights of Crb2a and Crb2b-lf are 161 and 160 kD, respectively. Western blots revealed higher apparent molecular weights for both Crb2a and Crb2b-lf, suggesting the presence of post-translational modifications. In addition, smaller-than-expected bands were detected, likely due to degradation or early termination of translation. The anti--tubulin blots served as sample loading controls. The specificity of the antibodies was also confirmed by the differences in their immnostaining patterns (Figures S1E and 2), as well as by the lack of immunoreactivity of crb2am289 mutant retinas to the anti-Crb2a antibodies (Figure 5B). The current data indicate that our previous immunohistological analyses of Crb expression patterns in zebrafish retina with the antibodies against the intracellular domains of mouse CRB1 and CRB2 were not completely accurate because both antibodies should have cross-reacted with zebrafish Crb2a and Crb2b due to high sequence similarity (Wei et al., 2006a). D. In situ hybridization analysis revealed that Crb2b expression is restricted in the photoreceptor layer. However, the probe designed to recognize crb2b-sf did not work, presumably because the probe is too short (246 nt). As expected, the negative control sense probe did not stain the retina. E. Crb2a is expressed at the apical surface (arrowheads) of the retina throughout retinal development, whereas Crb2b expression was detectable at the apical retinal surface at 72 hpf after embryonic photoreceptor differentiation but not at 24 and 48 hpf (arrowheads). The basal surfaces of the retina are marked by dashed lines. The arrows indicate the expression of Crb2a and Crb2b at the apical surface of the brain neuroepithelium, indicating that the lack of Crb2b signals in 24-hpf and 48-hpf retinas was not due to technical errors. The lenses are indicted with letters L. EXPRESSION / LABELING:
|
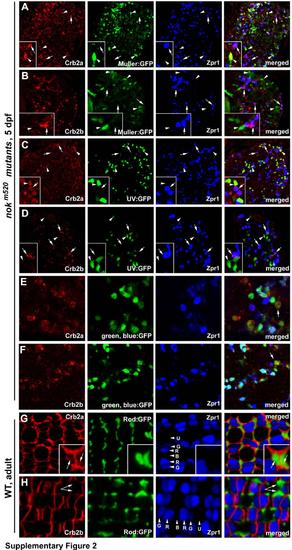
Crb2a is expressed in all types of cones, rods, and Müller cells, whereas Crb2b is predominantly expressed in green, blue and red cones but not in UV cones, rods, and Müller cells, related to Figure 2. The distribution of Crb2a and Crb2b was examined in 5-dpf nagie oko (nok) mutant retinas (panels A-F), where retinal cells scatter irregularly and Crb proteins are internalized (Wei et al., 2006a), as well as in wildtype adult retina (panels G and H). A, B. Crb2a and Crb2b expression patterns were examined in nokm520 mutant retinas in the Tg(gfap:GFP) mi2001 transgenic background, in which Müller cells were visualized by GFP (Bernardos and Raymond, 2006). C, D. Crb2a and Crb2b expression patterns were examined in nokm520 mutant retinas in the Tg(SWS1:GFP) transgenic background, in which UV cones were visualized by GFP (Takechi et al., 2003). E, F Crb2a and Crb2b expression patterns were examined in nokm520 mutant retinas in the Tg(RH2-1:GFP) pt112 transgenic background, in which blue and green cones (arrows) expressed stronger GFP signals than red cones (Zou et al., 2010). Thus, blue cones were positive expression of GFP and negative for Zpr1. G, H. Compared to cones, the inner segment of rods, which were visualized by GFP expression in the Tg(-3.7rho:EGFP)kj2 transgenic background (Hamaoka et al., 2002), are very thin and frequently form clusters around UV cones. Crb2a expression was detected at the interfaces of the rod inner segment clusters (G, arrows). By contrast, no Crb2b signals were detectable at the rod inner segment clusters (arrows). Lettered arrowheads indicate green (G), red (R), blue (B) and UV (U) cones. Double cones were visualized with zpr1 antibodies (blue). Insets show enlarged areas. |
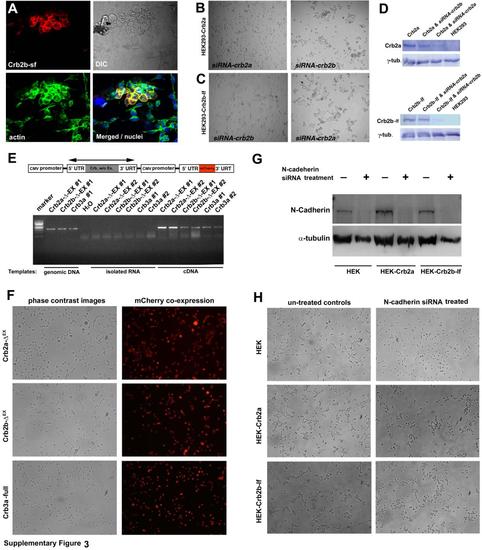
Expression of Crb variants that bear the extracellular domains in HEK cells prompted cell aggregation, related to Figure 4. Expression of full-length Crb2a, Crb2b-sf, or Crb2b-lf in HEK239 cells specifically introduced cell aggregation, and siRNA-mediated suppression of Crb2a or Crb2b-lf abolished cell aggregation. In addition, Crb2a- or Crb2b-lf-mediated HEK293 cell aggregation requires their extracellular domains, but is independent of N-cadherin. A. Transient expression of Crb2b-sf prompted cell aggregation in HEK293 cells. Crb2b-sf positive cells appeared round and formed a tighter and clumping cluster compared to their neighboring non-transfected cells. The cell nuclei were staining with DAPI in blue. B. The aggregation of the Crb2a-expressing HEK293 cells was blocked with the siRNAs against Crb2a but not with the siRNAs against Crb2b. C. The aggregation of the Crb2b-lf-expressing HEK293 cells was blocked with the siRNAs against Crb2b but not with the siRNAs against Crb2a. D. Western blot analyses showed that the protein expression level of Crb2a and Crb2b-lf was specifically and significantly suppressed with the siRNAs. The -tubulin (-tub.) blotting served as loading controls. The cell lines and siRNA treatments were indicated on top of the blots. E. A schematic illustrates the structures of transgenic constructs, each of which contains a gene for Crb2a-ΔEX, Crb2b-ΔEX, or Crb3a as well as a reporter gene of mCherry. Both genes are driven ubiquitously by the CMV promoter. The double-headed arrow indicates the region amplified by RT-PCR reactions, which verified that the Crb genes were expressed in the stably transfected HEK293 cell lines. Two stable clones of each transfection were analyzed by RT-PCR analyses using three different templates: with genomic DNA as positive controls for the robustness of the PCR reactions, with isolated RNA or water as negative controls for genomic DNA contamination, and with cDNA to confirm Crb gene expression. F. Stably transfected monoclonal HEK293 cells that express Crb2a-ΔEX, Crb2b-ΔEX, or Crb3a grew mostly individually. The mCherry expression verified that all cells were transgenic. G. To suppress N-cadherin expression, wildtype HEK293, Crb2a- and Crb2b-lf-expressing HEK 293 cells were transfected with the N-cadherin siRNAs. The expression levels of N-cadherin and cell aggregation phenotypes were analyzed one day after siRNA transfection. Western blotting analyses demonstrated that the N-cadherin siRNA treatments of the three cell lines almost completely abolished their N-cadherin expression. The loading controls were blotted with anti-α-tubulin antibody. H. Compared with untreated HEK293 cells, suppression of N-Cadherin expression in wildtype HEK293 cells reduced their tendency to aggregate. Suppression of N-Cadherin in Crb2a-expressing and Crb2b-lf-expressing HEK293 cells did not abolish the cell aggregation, suggesting the Crb2 can sufficiently mediate cell-cell adhesion independent of N-Cadherin. |
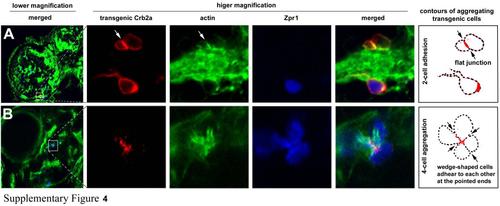
The aggregating patterns and cell shapes were influenced by the number of participating Crb2b-expressing transgenic cells in the crb2am289 mutant embryos, related to Figure 5. A. Three transgenic cells in the leftmost panel were magnified to better reveal their morphologies. The two cells above an actin-rich block of neuronal processes adhered to each other and established a flat adhering interface, which was enriched with Crb2a and actin compared to the rest of the cell membranes (arrows, the contour drawing). The bottom transgenic cell appeared to be prevented from adhering with the upper two cells by the block of neuronal processes. B. A mini rosette was formed by four Crb2b-expressing transgenic cells, which were also Zpr1 positive. These cells were wedge-shaped and adhered to each other at their pointed ends in the center of the aggregate, where Crb2a was enriched (arrows, the contour drawing). |
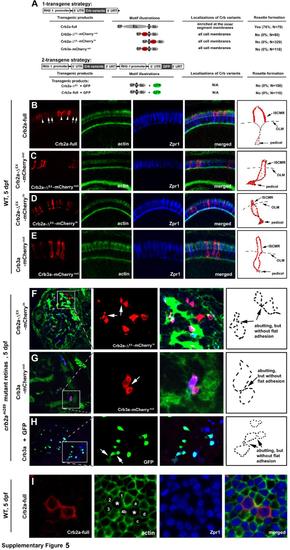
The extracellular domain of Crb2a is required for the localization of Crb2a to the inner segment cell membranes and for photoreceptor adhesion in zebrafish retinas, related to Figure 6. A. The schematics illustrate the two strategies to transgenically express Crb2a, Crb2a-ΔEX-mCherryout, Crb2a-ΔEX-mCherryin, Crb2a-ΔEX, Crb3a-mCherryout, or Crb3a in zebrafish retina. Individual protein domains are labeled as follows: SP, the signal peptide; Ex., the extracellular domain; T, the transmembrane domain; In., the intracellular domain; mC, mCherry; GFP, green florescent protein; -ΔEX, absence of the extracellular domain. The percentages of transgenic photoreceptors that formed rosettes in 5-dpf crb2am289 mutant retinas were quantified and summarized in the table. In addition, the subcellular localizations of the transgenic products in wildtype retina (vertical sections for B-E; transverse section for I) were summarized in the table as well. B-E. Wildtype full-length Crb2a (arrowheads) was highly enriched at the inner segment cell membranes in the photoreceptors (B), whereas Crb2a-ΔEX-mCherryout (C), Crb2a-ΔEX-mCherryin (D), and Crb3a-mCherryout (E) localized diffusively to the entire cell membranes of the transgenic photoreceptors. Due to the strong expression by the RH2-1 promoter, endogenous Crb2a (white arrows) appeared much weaker under exposure for better revelation of transgenically-expressed Crb variants. Schematic drawings in the right panels illustrate the membrane distribution patterns of Crb variants in a representative transgenic cone. F-H. Expression of the extracellular domain-lacking Crb variants Crb2a-ΔEX-mCherryin (F), Crb3a-ΔEX-mCherryout (G), or untagged Crb3a along with GFP (H) did not prompt photoreceptor aggregation in crb2am289 mutant embryos at 5 dpf. The leftmost panels show the entire retinal sections, in which the boxed local regions were magnified and presented in the middle panels for better illustration. Arrows indicate the abutting cells that did not adhere to each other to form a flat junctional interface as in Fig. 6H. Schematic drawings in the right panels illustrate the contours of representative transgenic cells that are abutting but not adhering to each other. Green staining is for actin, except as indicated. Double cones are shown in blue. Crb variants are in red. I. Overexpression of RH2-1 promoter-driven full-length wildtype Crb2a increased the sizes of the inner segments of transgenic cones. To quantify the increase in the sizes of the inner segments, the area of the transverse section of Zpr1 positive transgenic cones at the level of OLM was compared with the average size of their non-transgenic Zpr1 positive neighbor cones. For example, the size of the left transgenic cell was compared with the average size of its neighbor cells1-4, and the right cell with its neighboring cells a-d. A total of 28 transgenic cells were analyzed with MetaMorph 7.0 software, showing an average of a 1.79 fold increase in the cross section sizes at the OLM level. Full-length Crb2a (Crb2a-full) was visualized by the anti-Crb2a97-457 antibody. A weak imaging exposure was used to better reveal the overexpression of transgenic Crb2a but not the endogenous Crb2a. |
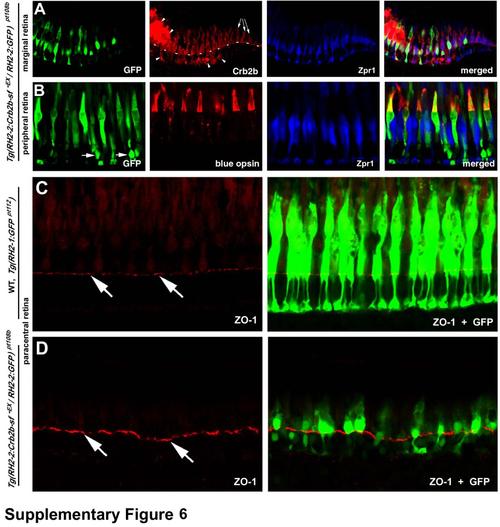
In Tg(RH2-2:Crb2b-sf-EX / RH2-2:GF) pt108b transgenic line, Crb2b-sf-EX and GFP is predominantly expressed in blue cones, and the overall integrity of the OLM is largely unaffected by the transgenic expression, related to Figure 7. A. At the marginal zone, exclusive endogenous Crb2b expression is indicated by the arrows. The lack of GFP and ectopic Crb2b immunoreactivity at the marginal zone suggests that the expression of the transgenes was slightly delayed compared to the endogenous crb2b gene, consistent with the activation pattern of the RH2-2 promoter (Takechi and Kawamura, 2005). The dashed line indicates the location of the OLM, and arrowheads indicate ectopic accumulation of Crb2b-sf-EX. B. The immunohistochemical analyses with anti-blue opsin antibodies (Vihtelic et al., 1999) demonstrated that the transgenes were mainly expressed in the blue cones in the peripheral, paracentral, and central retina in adult Tg(RH2-2:Crb2b-sf-EX / RH2-2:GF) pt108b. Arrowheads indicate GFP expression in some rods, whose cell nuclei were positioned basal to the OLM. C, D. Like in wildtype Tg(RH2-1:GFP) pt112 fish (C), overall integrity of the OLM (visualized by ZO-1 staining, arrows) was largely unaffected in Tg(RH2-2:Crb2b-sf-EX / RH2-2:GFP) pt108b transgenic line (D) at 24 mpf. |
Reprinted from Developmental Cell, 22(6), Zou, J., Wang, X., and Wei, X., Crb Apical Polarity Proteins Maintain Zebrafish Retinal Cone Mosaics via Intercellular Binding of Their Extracellular Domains, 1261-1274, Copyright (2012) with permission from Elsevier. Full text @ Dev. Cell