
- Title
-
beta-Catenin 1 and beta-catenin 2 play similar and distinct roles in left-right asymmetric development of zebrafish embryos
- Authors
- Zhang, M., Zhang, J., Lin, S.C., and Meng, A.
- Source
- Full text @ Development

Morpholino-mediated global knockdown of ctnnb1 or ctnnb2 leads to multiple LR defects in zebrafish embryos. (A-M) One-cell embryos were injected with individual morpholinos and examined for cmlc2 expression in the heart at 30 hpf (A-D) and at 48 hpf (E-H), and foxa3 in visceral organs at 48 hpf (I-M). Embryos representing different classes of phenotypes were in shown in dorsal (A-C,I-L) or ventral (E-G) views. Statistical data are shown in D,H,M, with the total observed number (n) indicated. V, ventricle; A, atria; l, liver; p, pancreas; g, gut. Scale bars: 100 μm. |

Knockdown of ctnnb1 and ctnnb2 in DFCs causes LR defects. (A,B) ctnnb1 (A) and ctnnb2 (B) expression in DFCs were detected by in situ hybridization. (C-H) Tg(sox17:GFP) transgenic embryos at 75% epiboly (C-E) and the three- to four-somite (F-H) stages were immunostained using anti-β-catenin and anti-GFP antibodies for detection of nuclear β-catenin in DFCs and KV cells. (I-K) Statistical data for the expression of indicated LR markers following midblastula injection. (L) The representative images show foxa3 expression in liver (l), pancreas (g) and gut (g) at 48 hpf. DFCs knockdown of ctnnb1 or ctnnb2 did not block liver and pancreas formation. |

Universal knockdown of ctnnb1 and ctnnb2 disturbs spaw and Nodal-regulated gene expression and impairs the midline barrier establishment. One-cell embryos were injected with indicated morpholinos. (A-D2) spaw expression in the perinodal region (black arrows) and left LPM (red arrows) at the six-somite (A-D) and 13-somite (A2-D2) stages, dorsal views. Embryos were staged by counting somite numbers. In the bottom left-hand corner was the number of embryos with the representative spaw expression around KV/total number of embryos. (E-L) Representative images of spaw expression in LPM at the 23-somite stage. (M,N) Statistical data for spaw in the LPM, lft1 in the diencephalon and lft2 in the heart primordium at 21.5 hpf (M) and 23 hpf (N), respectively. n, observed embryo number. (O-X) The representative patterns of ntl and lft1 in the midline (notochord) at about the 19- and 16-somite stages, respectively. The ratios are indicated in the bottom left-hand corner. Scale bars: 100 μm. |
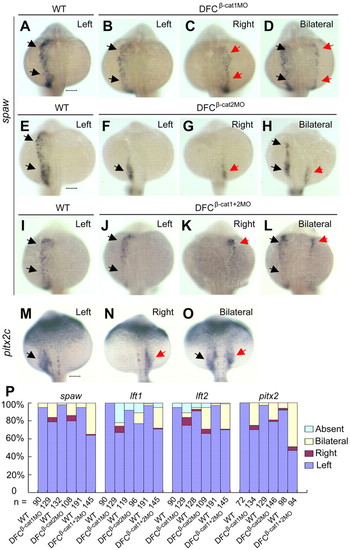
Knockdown of ctnnb1 and ctnnb2 in DFCs perturbs spaw and Nodal-regulated gene expression. Embryos at the 512-cell stage were injected. (A-L) Representative images show different patterns of spaw expression at about the 23-somite stage. The spaw domain in the left or right LPM is indicated by black or red arrows, respectively. Note that spaw expression was absent in the anterior LPM of DFCβ-cat2MO embryos. (M-O) Representative images of pitx2c expression in 23-somite stage embryos. The pitx2c domain in the left or right posterior LPM is indicated by black or red arrows, respectively. Scale bars: 100 μm. (P) Statistical data for spaw in the LPM, lft1 in the diencephalon, lft2 in the heart primordium and pitx2c in the posterior LPM at the 23-somite stage. |

ctnnb1 but not ctnnb2 is required for charon expression. Embryos were injected with individual or mixed morpholinos at the 512-cell stage (D-G,K-N) or with individual morpholinos at the one-cell stage (A-C,H-J), and examined for charon expression at six- and 13-somite stages. (A-N) Dorsal views of the tailbud region show charon expression around KV. Scale bars: 100 μm. charon levels in ctnnb1 morphants are decreased but change little in ctnnb2 morphants. (O,P) Statistical data for laterality alterations of spaw expression. # indicates 40 ng β-cat2MO; others are 20 ng for each MO. |

ctnnb1 and ctnnb2 in DFCs are required for KV and cilia formation. Embryos were injected with individual or mixed morpholinos at the 512-cell stage and visualized after immunostaining at the 10-somite stage. (A-E) KV cilia were visualized by anti-acetylated-tubulin antibody. Morphants had fewer and shorter cilia. Scale bar: 20 μm. (A′-E′) KV lumen cells labeled by anti-ZO-1 antibody. The embryos were identical to those in A-E. (F-J) The KV fluid flow was monitored by observing movements of injected fluorescent beads. Each colored line represented the kinetic track of a single bead and the arrowhead indicates the moving direction. The moving paths in morphants were disordered. (K,L) Quantification of cilia number (K) and length (L). Error bars indicate ±s.e.m.; n, analyzed embryo number. Statistical significance: ns, P>0.05; **P<0.01. Student’s t-test was used. |
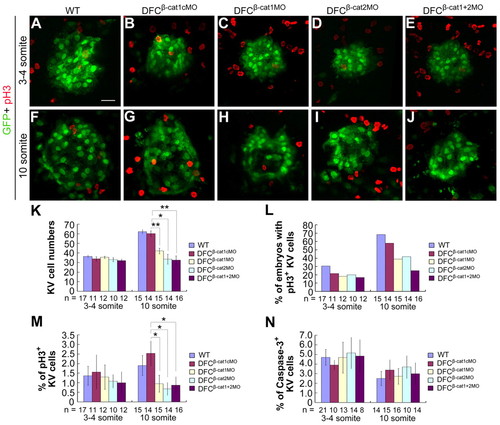
DFCs knockdown of ctnnb1 and ctnnb2 inhibits KV cell proliferation. Tg(sox17:GFP)s870 transgenic embryos were injected with individual or mixed morpholinos at the 512-cell stage and analyzed later, as indicated. (A-J) Confocal images of KVs at the three- to four-somite (A-E) and 10-somite stages (F-J) following immunostaining with anti-GFP and anti-pH3 antibodies. (K) KV (GFP-positive) cell number was counted at different stages. (L) The percentage of embryos with pH3-positive KV cells. (M) The average percentage of pH3-positive KV cells per embryo. The percentage was calculated for each embryo and then averaged among all observed embryos. The same batch of embryos was subjected to different analyses shown in K-M. (N) The average percentage of caspase 3-positive KV cells per embryo. The injected embryos were co-immunostained with anti-GFP and anti-active caspase 3 antibodies at different stages and observed by confocal microscopy. *P<0.05; **P<0.01; Error bars indicate ±s.e.m.; n, analyzed embryo number. |

Effects of ctnnb1 and ctnnb2 knockdown in DFCs on DFCs-specific marker gene expression. Embryos at the 512-cell stage were injected and later examined for marker expression. (A-J) sox17 (A-E) and foxj1a (F-J) expression in DFCs at the 90% epiboly stage were unaltered in morphants. In the top right-hand corner of each picture are the number of embryos with the representative phenotype versus the total number of analyzed embryos. (K-O) tbx16 expression in DFCs at 75% epiboly stage was disrupted in morphants. Yellow arrows indicate the position of DFCs. (P-T) ntl expression in DFCs at 75% epiboly stage was impaired in morphants. Two-color in situ hybridization using ntl (red) and lft1 (dark purple) probes were performed. The expression domain of ntl in DFCs was indicated by white arrows. (P′-T′) Higher magnification images of the boxed areas in P-T. (U) Statistical data for ntl and tbx16 expression in DFCs. All embryos are shown as dorsal views with animal pole towards the top. |