
- Title
-
The Expression of irx7 in the Inner Nuclear Layer of Zebrafish Retina Is Essential for a Proper Retinal Development and Lamination
- Authors
- Zhang, Y., Yang, Y., Trujillo, C., Zhong, W., and Leung, Y.F.
- Source
- Full text @ PLoS One
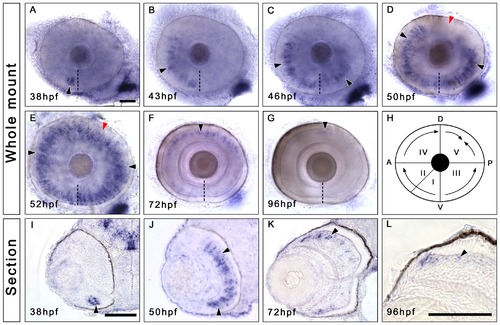
Irx7 is specifically expressed in the prospective INL during zebrafish retinal development. Whole-mount in situ hybridization was conducted to elucidate the expression dynamics of irx7 in embryonic retinas. (A–G) Dissected eyes obtained from embryos between 38 to 96 hpf. Anterior is to the left and dorsal is up. The black arrowheads indicate the irx7+ cells (blue colour) in the retina, the dashed lines indicate the choroid fissure, while the red arrowheads in (D and E) indicate the posterior dorsal region of the retina, the last region to express irx7. (H) A schematic diagram of irx7 expression dynamics in the retina from 38 to 52 hpf. The Roman numerals indicate the order of five retinal regions in which irx7 appears sequentially. (I–L) Transverse retinal section of the corresponding whole-mount embryo at 38, 50, 72 and 96 hpf. Lateral is to the left and dorsal is up. The black arrowheads indicate the irx7+ cells in the retina. Scale bars = 50 μm. |
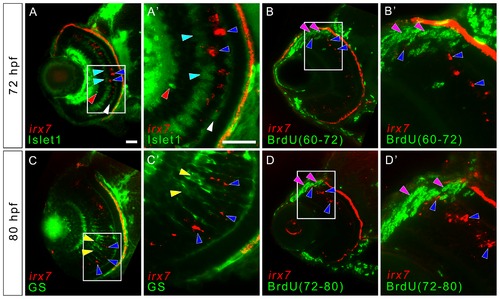
Irx7 expresses in non-proliferative cells that are likely to be undifferentiated precursors in mature retina. To detect for the co-localization of irx7 and ACs, BCs, HCs, MCs and proliferative cells in the more differentiated part of the WT retina, in situ hybridization of irx7 was conducted in conjunction with immunostaining of anti-Islet1 for ACs, BCs and HCs, anti-GS for MCs and anti-BrdU for proliferative cells. (A) irx7 in situ hybridization with anti-Islet1 immunostaining at 72 hpf. The blue arrowheads indicate the irx7+ cells (red colour) in the retina, while the red, cyan and white arrowheads indicate ACs, BCs and HCs respectively (all in green colour). (A2) The magnified view of the white box in (A). (B and D) The retina of embryos treated with BrdU from 60 to 72 hpf and 72 to 80 hpf respectively. The blue arrowheads indicate irx7+ cells (red colour), while the pink arrowheads indicate BrdU+ cells (green colour). (B2 and D2) The magnified view of the white box in (B and D) respectively. (C) irx7 in situ hybridization with anti-GS immunostaining at 80 hpf. The blue arrowheads indicate the irx7+ cells (red colour), while the yellow arrowheads indicate MCs (green colour). (C2) The magnified view of the white box in (C). Lateral is to the left and dorsal is up for all sections. Note that the RPE layer also showed red fluorescence but that was not a real signal. It was an artifact of the pigmentation in RPE. Since the images of the in situ hybridization were inverted before combining with the fluorescent images obtained from the immunostaining, the darker pigment in RPE, as well as the intense in situ colour, would appear as signal in this transformation. Scale bars = 20 μm. EXPRESSION / LABELING:
|

The phenotypes of irx7SMO and irx7MO2 morphants at 72 hpf. Phenotypic analysis of the optimized irx7SMO (A–E) and irx7MO2 (F–J) injection experiments. (A) The lateral view of an uninjected control embryo for irx7SMO injection experiments. (B) An embryo injected with 10 ng of Control MO. (C–E) Three phenotypic categories of the morphants after injected with 10 ng of irx7SMO. The percentage of embryos that had mild (C), intermediate (D) and severe (E) phenotypes was 13.52% (N = 106), 69.81% (N = 444) and 16.67% (N = 86) respectively. (F) The lateral view of an uninjected control embryo for irx7MO2 injection experiments. (G) An embryo injected with 3 ng of irx7MO2-6 bms. (H–J) Three phenotypic categories of morphants after injected with 3 ng of irx7MO2. The percentage of embryos that had mild (H), intermediate (I), and severe (J) phenotypes were 13.28% (N = 38), 73.78% (N = 211) and 12.94% (N = 37) respectively. Scale bar = 200 μm. PHENOTYPE:
|
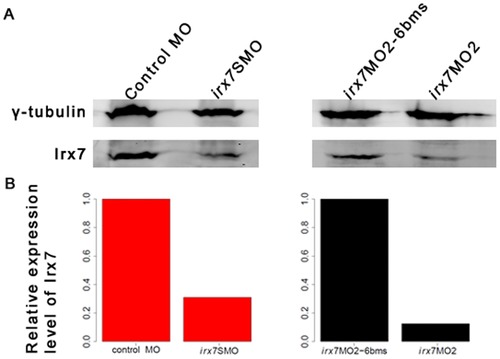
Microinjection of irx7SMO (10 ng) and irx7MO2 (3 ng) drastically reduces Irx7 protein level. The heads of 35 embryos injected with control MO and irx7SMO, and 30 embryos injected with irx7MO2-6 bms and irx7MO2 were dissected at 72 hpf. Proteins were then extracted from these samples and Irx7 expression detected by Western blot using anti-Irx7-234 (A). Γ-tubulin was used as a loading control. The specificity of the Irx7 antibodies was first confirmed by Western blot using various recombinant Irx7 proteins of different lengths (Table S1 and File S3) expressed from bacterial culture (data not shown). Using the information extracted from the Western blot, the protein level of Irx7 was found to be reduced by 69.01% and 87.58% respectively in the dissected heads of irx7SMO and irx7MO2 morphants when compared to the corresponding controls (B). EXPRESSION / LABELING:
|
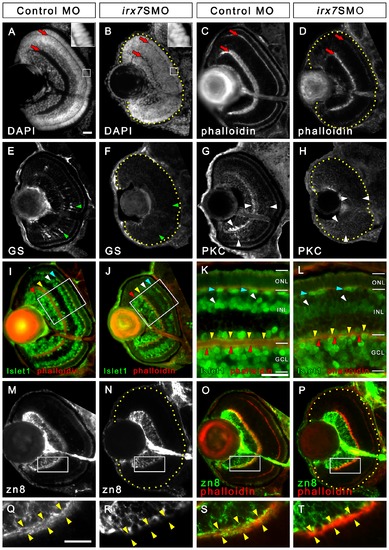
Irx7 knockdown reduces eye size and compromises retinal lamination, INL cells differentiation and dendritic projection of GCs into the INL. Irx7 knockdown reduced eye size and compromised retinal lamination at 72 hpf, as indicated by the DAPI (A and B) and phalloidin (C and D) stains that highlight nuclei and plexiform layers respectively. The red arrows indicate the IPL and OPL. The insets of (A) and (B) also show that the normal elongated morphology of the photoreceptors in control was compromised in the Irx7 morphant. The INL cells differentiation was analyzed by anti-GS for MCs (E and F), anti-PKC for BCs (G and H) and anti-Islet1 for ACs, BCs and HCs (I–L) at the same stage. Irx7 knockdown did not decrease the zn8+ GCs (N) compared with the controls (M), except for the elimination of a fuzzy domain on the apical side of the GCL (compare Q and R). This domain likely represents the dendritic projections of the GCs into the IPL, as it overlapped with the phalloidin staining of the IPL substantially (O and S). This overlap was completely absent in the morphants (P and T). Lateral is to the left and dorsal is up for all sections, except for (K and L), in which the apical side of retina is up. In addition, the retinal region in the samples with weak signal is highlighted by a dotted yellow line. The features indicated by the arrowheads are further discussed in the text. Scale bars = 20 μm. EXPRESSION / LABELING:
PHENOTYPE:
|
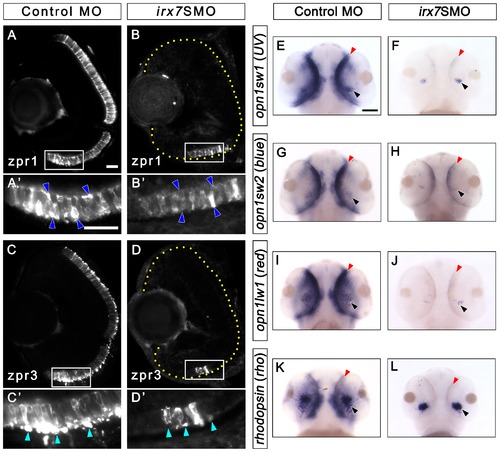
Irx7 knockdown compromises photoreceptor differentiation at 72 hpf. Irx7 knockdown compromised the staining of anti-zpr1 for red-green double cones and anti-zpr3 for rods in the morphants (B and D) compared with the controls at 72 hpf (A and C). (A2, B2, C2 and D2) The corresponding magnified view of the positive signal area in the white box in A, B, C and D. The features indicated by the arrowheads are further discussed in the text. Lateral is to the left and dorsal is up for all sections. In addition, the retinal region in the samples with weak fluorescent signal is highlighted by a dotted yellow line. (E–L) Whole-mount in situ hybridization of three cone opsins (uv, blue and red) and one rod opsin (rho) also indicate the differentiation of these photoreceptors was compromised. The most common staining pattern is shown. The black arrowheads indicate the specific staining (blue colour) of the ventral patch, while the red arrowheads indicate the staining in the ONL. Embryos were imaged from the ventral side and anterior is up. Scale bars = 20 μm for (A)–(D) and 50 μm for (E)–(L). EXPRESSION / LABELING:
PHENOTYPE:
|

Irx7 knockdown does not induce apoptosis but can delay cell cycle withdrawal. Immunostaining of embryos injected with 10 ng of control MO or irx7SMO were conducted with anti-active caspase3 antibody (green colour) at 28, 36, 52 and 72 hpf. The nuclei were counterstained with DAPI (blue colour). In both controls (A–D) and irx7SMO morphants (E–H), only a few active caspase3+ cells (white arrowheads) were detected in some retinas at all stages. All cells that showed a positive anti-active caspase3 signal had the characteristic cell shrinkage and rounded morphology, as shown by the DAPI staining. While all active caspase3- cells looked healthy. Mitotic cells were detected by anti-PH3 in the retinas of controls (I) and morphants (J) at 72 hpf. PH3+ cells in the MZ and in the ectopic apical retina are indicated by green and yellow arrowheads respectively. (K) A stripchart of the number of PH3+ cell per retinal area in uninjected embryos, controls and morphants. Retinal cells that had gone through S-phase in controls and morphants were also detected by BrdU incorporation from 36 to 52 hpf (L and M) and from 52 to 72 hpf (O and P). (N and Q) The corresponding stripcharts of BrdU+ area per retinal area in the uninjected embryos, controls and morphants. The asterisks in all stripcharts represent the median of each group. Lateral is to the left and dorsal is up for all sections. The retinal region in these samples is highlighted by a dotted yellow line. Scale bar = 20 μm. PHENOTYPE:
|

Irx7 regulates the expression of TFs that specify retinal cell types in INL at 52 and 72 hpf. Whole-mount in situ hybridization of vsx1 (A–D), vsx2 (E–H), ptf1a (I–L) was conducted. The most common staining pattern is shown. Embryos were imaged from the ventral side and anterior is up. See text for further discussions. The results for neurod, a TF that specifies cells in both INL and ONL, will be presented in Figure 9. Scale bar = 50 μm. EXPRESSION / LABELING:
|
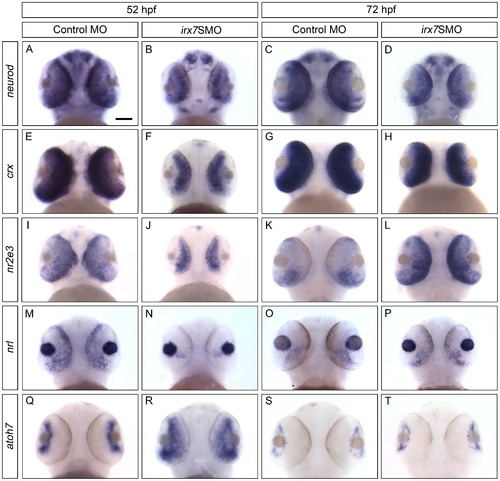
Irx7 regulates the expression of TFs that specify retinal cell types in ONL and GCL at 52 and 72 hpf. Whole-mount in situ hybridization of neurod (A–D), crx (E–H), nr2e3 (I–L), nrl (M–P) and atoh7 (Q–T) was conducted. The most common staining pattern is shown. Embryos were imaged from the ventral side and anterior is up. See text for further discussions. Scale bar = 50 μm. EXPRESSION / LABELING:
|
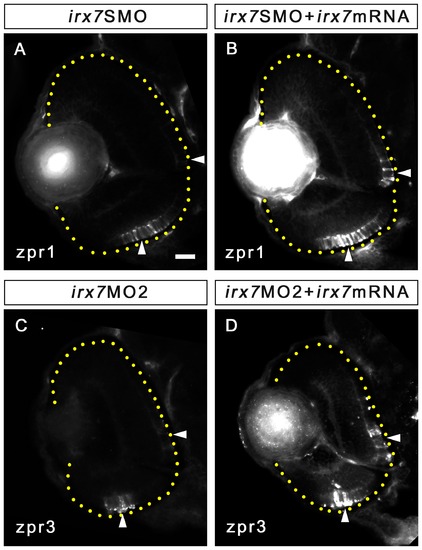
Irx7 mRNA can partially rescue the effects caused by Irx7 knockdown. (A and B) Immunostaining of anti-zpr1 for cones on the retinal section of an morphant and a rescued embryo at 72 hpf respectively. (C and D) Immunostaining of anti-zpr3 for rods on the retinal section of an irx7MO2 morphant and a rescued embryo at 72 hpf respectively. Lateral is to the left and dorsal is up for all sections. The retinal region in the samples is highlighted by a dotted yellow line. The comparable regions in the retinas are highlighted by white arrowheads. Scale bar = 20 μm. EXPRESSION / LABELING:
PHENOTYPE:
|

Irx7 knockdown compromises differentiation of MCs. Ten nanograms of control MO and irx7SMO was injected into Tg(gfap:GFP)mi2001 embryos. Expression level of the GFP in the retinas was examined in at 59 and 72 hpf. The red arrowheads indicate GFP+ cells, except for the morphant at 59 hpf, which indicate a comparable region of the retina as the control. The retinal area is highlighted by a dotted yellow line. Scale bar = 20 μm. |