
- Title
-
The regenerative capacity of the zebrafish heart is dependent on TGFβ signaling
- Authors
- Chablais, F., and Jazwinska, A.
- Source
- Full text @ Development
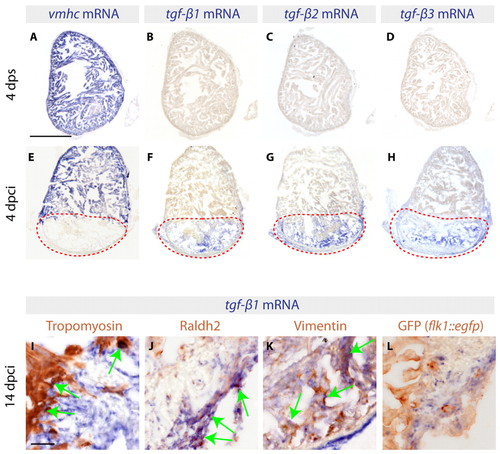
Three TGFβ ligands are expressed in the infarct zone following cryoinjury. (A-H) In situ hybridization of consecutive heart sections with vmhc, tgfb1, tgfb2 and tgfb3 mRNA antisense probes (blue) of control zebrafish hearts at 4 days post sham surgery (dps) (A-D) and of cryoinjured hearts at 4 days post cryoinjury (dpci) (E-H). Red dashed lines encircle the injured areas. (A,E) At 4 dps, vmhc expression labels the intact ventricle. (B-D) None of the three TGFβ transcripts is detected in uninjured hearts. (E) The absence of vmhc mRNA demarcates the infarct area at 4 dpci. (F-H) At 4 dpci, tgfb1, tgfb2 and tgfb3 are upregulated in the injured area. (I-L) Heart sections at 14 dpci double-stained by in situ hybridization using tgfb1 probe (blue) and immunohistochemistry using different cell type markers (brown). Arrows indicate double-positive cells. (I) Intact Tropomyosin-labeled myocardium does not express tgfb1, with the exception of cardiomyocytes abutting the infarct. (J) Raldh2-positive epicardial cells invading the injury area are co-labeled by tgfb1 staining. (K) Vimentin-expressing fibroblasts of the infarct express tgfb1. (L) GFP expressed under the endothelial cell promoter flk1 (kdrl – Zebrafish Information Network) does not colocalize with tgfb1. Scale bars: 300 μm in A; 50 μm in I. |

Smad3-dependent TGFβ/Activin signaling is suppressed by the SB431542 inhibitor (Alk5/4-i) after myocardial infarction. (A-B′) At 14 dpci, heart sections from transgenic fish expressing nuclear DsRed2 (red) under the cmlc2 cardiomyocyte-specific promoter were immunoassayed for Tropomyosin (TPM, blue) to visualize the intact myocardium and phospho-Smad3 (pSmad3, green). DAPI (yellow in the left panels) marks all the nuclei. The infarct is determined by the absence of Tropomyosin and DsRed2 expression (encircled by dashed lines). (A′,B′) Higher magnifications of the boxed areas in A,B. pSmad3-positive cardiomyocytes are indicated with arrowheads. (A,A′) Control regenerating hearts display numerous pSmad3-positive nuclei (green) in the injury area and in some cardiomyocytes at the infarct boundary. Arrows (A) indicate new myocardium surrounding the post-infarct. (B,B′) Treatment with 10 μM Alk5/4-i severely reduces pSmad3 staining. The injury area is larger than in the control and no invasion of cardiomyocytes is detected. (C) Quantification of pSmad3-positive cardiomyocytes in control and Alk5/4-i-treated hearts at 14 dpci. Error bars indicate s.e.m.; n=9; *P<0.01, t-test. Scale bars: 300 μm. |

Inhibition of TGFβ/Activin signaling blocks heart regeneration resulting in the infarct bulging phenotype. Acid Fuchsin Orange-G (AFOG) staining of heart sections visualizes healthy myocardium (orange), fibrin (red) and collagen (blue). (A-D) Control hearts, (E-H) Alk5/4-i-treated hearts, (I-L) hearts of transgenic fish expressing heat shock-inducible dn-fgfr1. (A,E,I) Control ventricles after sham operation (4 dps) consist of healthy myocardium. (B,F,J) At 4 dpci, similar infarcts (red) are detected in all experimental groups. (C,G,K) Hearts at 14 dpci. (C) Control hearts contain abundant fibrillar collagen in the injury area. A layer of fibrin (red) covers the margin of the infarct. New myocardium begins to invade the scar tissue (arrows). (G) Exposure to Alk5/4-i suppresses collagen deposition. No myocardial invasion is observed. (K) Inhibition of FGF signaling does not impair collagenous scar formation in comparison to control. (D,H,L) Hearts at 30 dpci. (D) In control hearts, the scar was nearly completely resolved and replaced with new muscle. (H) Alk5/4-i blocked regeneration. The infarct is surrounded by a fibrin layer but it is collagen deficient. The injury area bulges beyond the ventricular circumference. (L) Overexpression of dn-fgfr1 blocks regeneration, resulting in a collagen-rich scar. No geometrical deformation is associated with the lack of regeneration. Scale bar: 300 μm. |

Transient scar formation is an essential reparative step toward heart regeneration. AFOG staining of zebrafish hearts at 28 dpci after a transient drug treatment during the initial 14 days (A,C) or the final 14 days (B,D) of the experiment. (A,B) Control (DMSO-treated) hearts display normal regeneration. Only a small area contains collagen fibers (arrow). (C) Inhibition of Alk5/4 during the initial phase of scar formation is deleterious, resulting in a complete lack of regeneration. Despite the subsequent 14 days of normal conditions, the post-infarct developed an inflated infarct phenotype. (D) Inhibition of Alk5/4 starting at 14 dpci, after the time needed for scar deposition, does not cause architectural deformations of the post-infarct. The injury site contains collagen, but scar replacement with cardiac tissue appears to be impaired in comparison to control (B). Scale bar: 300 μm. |
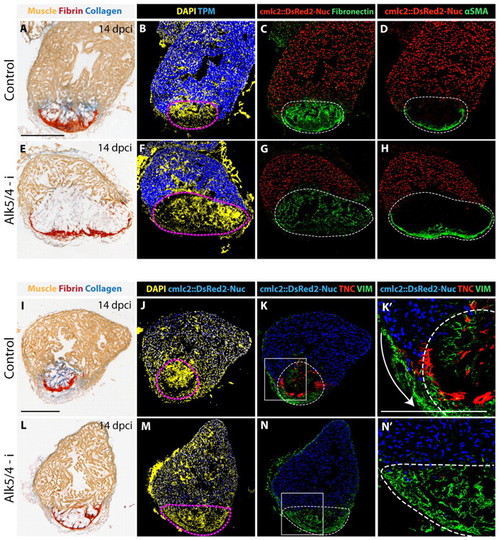
Inhibition of Alk5/4 impairs the production of ECM proteins in the post-infarct. Analyses of heart sections from transgenic fish expressing nuclear DsRed2-Nuc under the cmlc2 cardiomyocyte-specific promoter at 14 dpci. Dashed lines represent the injured areas. DsRed2-Nuc is in red (C,D,G,H) or blue (J-K′,M-N′). (A-D,I-K′) Adjacent sections of control hearts. (E-H,L-N′) Adjacent sections of Alk5/4-i-treated hearts. (A,I) AFOG staining visualizes abundant collagen fibers (blue) at the injury site of control hearts. (E,L) Inhibition of TGFβ/Activin signaling blocks collagen deposition. (B,F) The injury site is demarcated by the absence of Tropomyosin protein (blue). The post-infarct is larger in hearts treated with the drug (F) than in control (B). DAPI (yellow) labels all nuclei. (C,G) Exposure to Alk5/4-i (G) attenuates Fibronectin production (green) in comparison to control (C). (D,H) α-smooth muscle actin-positive cells (αSMA, green) equally surround the post-infarct border in control and drug-treated hearts. (J,M) The injury site is demarcated by the absence of cmlc2::DsRed2-Nuc (blue). DAPI (yellow) labels all nuclei. (K,K′,N,N′) The contra-adhesive matrix protein Tenascin C (TNC, red) is predominantly upregulated at the infarct-myocardium interface in control hearts (K,K′). Treatment with Alk5/4-i completely abolished Tenascin C expression, but increased Vimentin-positive tissue (green; N,N′). (K′,N′) Higher magnifications of the boxed areas in K,N. Arrow (K′) indicates the invasion of new myocardium. Scale bars: 300 μm. |

TGFβ/Activin signaling promotes cardiomyocyte proliferation during heart regeneration. (A,A2,C,C′) Heart sections of transgenic cmlc2::DsRed2-Nuc (red) fish immunostained for Tropomyosin (blue) and Mcm5 (green) to detect mitotic cells at 14 dpci. DAPI (yellow in the left panels) marks nuclei. Proliferating cardiomyocytes are identified by co-expression of DsRed2 and Mcm5. The post-infarcts are encircled by dashed lines. (A′,C′) Higher magnifications of the boxed areas in A,C. (A,A′) In control hearts, proliferating cardiomyocytes are located in the vicinity of the injury site. Non-cardiac Mcm5-positive cells are distributed predominantly at the post-infarct wall. Arrow (A′) indicates the invasion of new myocardium. (C,C′) Exposure to Alk5/4-i attenuates cardiomyocyte proliferation and expansion. (B) The ratio of Mcm5-positive DsRed2-positive nuclei to all DsRed2-positive nuclei demonstrates a reduction of proliferating cardiomyocytes after drug treatment (n=10). (D) The ratio of Mcm5-positive to DAPI-positive nuclei shows enhanced proliferation of non-cardiac cells after drug treatment (n=10). (E) Experimental design to demonstrate the immediate effect of Alk5/4-i on cardiomyocyte proliferation. (F-G′) Confocal images of hearts from cmlc::DsRed2-Nuc (red) transgenic fish. Tropomyosin (blue), DAPI (yellow), BrdU (green). Proliferating cardiomyocytes are identified by the co-expression of DsRed2 and BrdU. Dashed lines indicate the post-infarct. (F′,G′) Higher magnifications of the boxed areas in F,G. (H) The ratio of BrdU-positive DsRed2-positive nuclei to all DsRed2-positive nuclei. BrdU incorporation in cardiomyocytes was significantly decreased after Alk5/4-i exposure. Error bars indicate s.e.m.; n=10; *P<0.05, t-test. Scale bars: 300 μm. |

Expression of Activin-β ligands in cryoinjured heart. In situ hybridization of consecutive heart sections with vmhc, activin-βA and activin-βB mRNA antisense probes (blue staining) at different phases of heart regeneration. (A-C) In uninjured sham operated hearts at 4 dps, vmhc (A) is expressed in the entire ventricle, whereas activin-βA (B) and activin-βB (C) do not display significant expression. (D-F) In regenerating hearts at 4 dpci, the absence of vmhc (D) marks the injury area (red dashed line). activin-βA (E) is detected in the infarct zone. activin-βB (F) is induced in the whole infarcted ventricle including the myocardium and the injury site. (G-I) At 14 dpci, the post-infarct area (red dashed lines) is smaller than at 4 dpci. activin-βA (H) is detected in the injury area. activin-βB (I) is expressed in the whole infracted ventricle. Scale bar: 300 μm. |
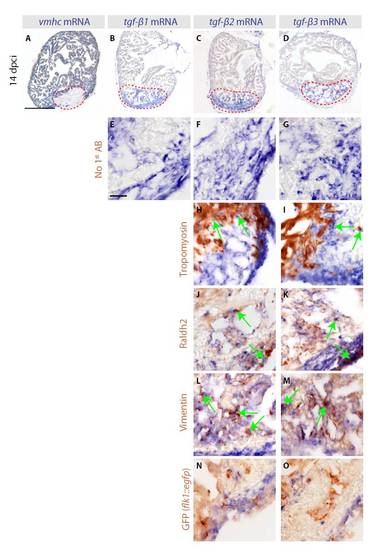
The expression of three TGFβ ligands is induced in an overlapping pattern at the post-infarct zone. (A-D) In situ hybridization of consecutive heart sections with vmhc, tgfb1, tgfb2 and tgfb3 mRNA antisense probes (blue staining) of cryoinjured hearts at 14 dpci. Red dashed lines demarcate the cryoinjured areas. (A) The absence of vmhc mRNA demarcates the infarct area. (B-D) tgfb1, tgfb2 and tgfb3 are upregulated in the injured area at 14 dpci. Scale bar: 300 μm. (E-O) In situ hybridization using tgfb1, tgfb2 and tgfb3 mRNA antisense probes (blue staining) followed by immunohistochemistry (brown) of heart sections at 14 dpci. Scale bar: 50 μm. (E-G) A control of immunohistochemistry without incubation with primary antibodies. As expected, no brown staining is detected. (H-O) Various primary antibodies were used to label different cell types of the heart (brown). Arrows indicate double-positive cells. (H,I) tgfb2 and tgfb3 are not expressed in the Tropomyosin-stained myocardium, except for a thin layer of cardiomyocytes adjacent to the infarct boundary. (J,K) Raldh2-positive epicardial cells invading the injured area are co-labeled with tgfb2 and tgfb3 staining. (L,M) Vimentin-positive fibroblasts of the post-infarct overlap with tgfb2 and tgfb3 staining. (N,O) Endothelial cells labeled by GFP expression of transgenic fish (flk1::egfp) do not express tgfb2 and tgfb3. The equivalent data for tgfb1 are shown in Fig. 1. |
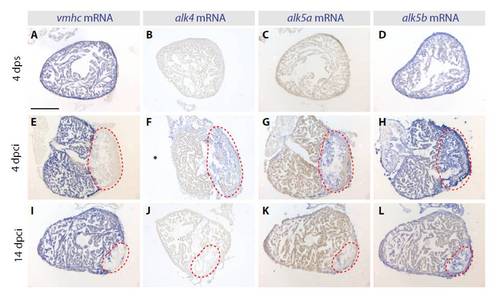
Expression patterns of TGFβ/Activin type I receptors in the cryoinjured hearts. In situ hybridization of consecutive heart sections with vmhc, alk4, alk5a and alk5b mRNA antisense probes (blue staining) at different phases of heart regeneration. (A-D) In uninjured sham operated hearts at 4 dps, vmhc (A) is expressed in the entire ventricle, whereas alk4 (B) and alk5a (C) are not detected. alk5b (D) is ubiquitously expressed in the ventricle. (E-L) In regenerating hearts at 4 and 14 dpci, the absence of vmhc demarcates the injury site (red dashed lines). alk4 and alk5a are weakly induced in the post-infarct area. alk5b is expressed in both the intact myocardium and in the post-infarct. Scale bar: 300 μm. |
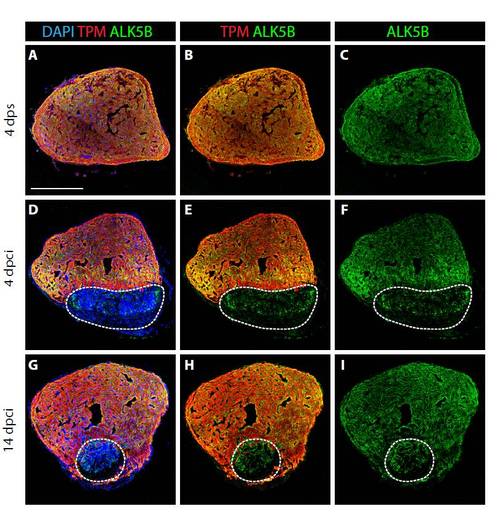
TGFβ type I receptor Alk5b is expressed in control and regenerating hearts. (A-I) Confocal images of heart sections at different time points after surgery. Staining for Tropomyosin (TPM, red), which labels cardiac muscle, Alk5b (green), and with DAPI (blue), which stains all the nuclei. At 4 dps (A-C), Alk5b protein is detected throughout the entire ventricle. At 4 dcpi (D-F) and at 14 dpci (G-I), Alk5b is present in the intact tissue and in the injured area (white dashed line). Scale bar: 300 μm. |

Alk5b is expressed in cardiomyocytes and vimentin-positive cells of cryoinjured hearts. (A-D) High magnification of the ventricle after sham surgery immunostained for Tropomyosin (red), Alk5b (green) and DAPI (blue). (C,D) Higher magnifications of the framed area in the corresponding upper panels. (E,F) Single grayscale channel showing Tropomyosin (E) and Alk5b (F). In uninjured myocardium, linear pattern of Alk5b staining corresponds to the plasma membrane of cardiomyocytes. Tropomyosin staining labels striated muscle fibers. (G-J) High-magnification images of a post-infarct zone from cryoinjured heart at 4 dpci, stained for the fibroblast marker Vimentin (red), Alk5b (green) and DAPI (blue). (I,J) Higher magnifications of the framed area in the corresponding upper panels. (K,L) Single grayscale channel showing Vimentin (K) and Alk5b (L). Vimentin-positive cells express transmembrane receptor Alk5b. Scale bars: 100 μm in A,G; 10 μm in C,I. |
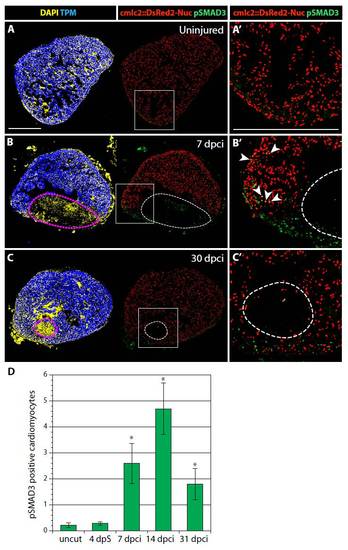
Alk5/4-dependent TGFβ/Activin signaling activates non-cardiac cells of the post-infarct and adjacent cardiomyocytes of the intact myocardium. (A-C′) Confocal images of heart sections from transgenic fish expressing nuclear DsRed2-Nuc (red) under the control of the cmlc2 cardiomyocyte-specific promoter. Immunostaining for Tropomyosin (TPM, blue) labels the myocardium and phospho-Smad3 (pSmad3, green) detects activation by Alk5/4-dependent TGFβ/Activin signaling. DAPI (yellow in the left panels) marks all the nuclei. Signal-activated cardiomyocytes are identified by the co-expression of DsRed2-Nuc and pSmad3. Dashed lines (B,C) denote the post-infarct. (A′-C′) Higher magnifications of the framed area in the corresponding left panels. (A,A′) In uninjured hearts, pSmad3 is not detected. (B,B′) At 7 dpci, numerous non-cardiac cells in the injury area contain pSmad3-positive nuclei. pSmad3 is also detected in a few cardiomyocytes in the vicinity of the post-infarct (arrowheads). (C,C′) At 30 dpci, when the heart is nearly regenerated, only a few pSmad3-positive cells remain around the injury area. (D) Quantification of pSmad3-positive cardiomyocytes. *P<0.05 compared with uncut, t-test; n=10; error bars indicate s.e.m. Scale bar: 300 μm. |

Cellular composition of the post-infarct after inhibition of TGFβ/Activin signaling. (A-F) Immunostaining of heart sections at 30 dpci using different markers. (A,D) Tropomyosin (TPM, red) labels cardiac muscle, the adhesive matrix glycoprotein Fibronectin (green) marks the connective tissue and DAPI visualizes the nuclei (blue). (A′,D′) Higher magnifications of the framed area in the corresponding left panels. (B,E) Tropomyosin (TPM, red) and α-smooth muscle actin (αSMA, green), a marker of myofibroblasts. (C,F) The de-adhesive matrix protein Tenascin C (TNC, red), fibroblast marker Vimentin (VIM, green) and DAPI (blue). (A-C) Consecutive sections of control hearts demonstrate a nearly complete replacement of the fibrotic tissue with Tropomyosin-expressing cardiomyocytes. Residual Fibronectin, αSMA and Tenascin C demarcate the initial injury site. (D-F) Consecutive sections of Alk5/4-i-treated hearts reveal a large Tropomyosin-negative area, which demarcates a lack of cardiac regeneration (yellow dashed line). The injury area comprises a network of connective tissue visualized by Fibronectin and Vimentin expression. A layer of myofibroblasts is located at the periphery of the post-infarct. Scale bar: 300 μm. |

The injury-induced response of the epicardium and endocardium is not affected by Alk5/4-i treatment. (A-C) Immunofluorescent analysis of heart sections using the cardiac marker Tropomyosin (TPM, blue in left panels and red in middle and right panels) and Raldh2 (green). DAPI (yellow) in left panels labels all nuclei. (A′-C′) Higher magnification of the framed area in the left panel. (A,A′) In uninjured hearts, the epicardium is demarcated by Raldh2 expression (arrows). (B,B2) At 14 dpci, control hearts display the activation of Raldh2 expression in the endocardium (arrowheads). Epicardial cells surround the injured area (arrows). Raldh2-positive cells invade the post-infarct area (dashed line). (C,C2) At 14 dpci, Alk5/4-i-treated hearts show a similar Raldh2 expression pattern to the control. Scale bar: 300 μm. |

The injury-induced response of the epicardium and endocardium is not affected by Alk5/4-i treatment. (A-C) Immunofluorescent analysis of heart sections using the cardiac marker Tropomyosin (TPM, blue in left panels and red in middle and right panels) and Raldh2 (green). DAPI (yellow) in left panels labels all nuclei. (A′-C′) Higher magnification of the framed area in the left panel. (A,A′) In uninjured hearts, the epicardium is demarcated by Raldh2 expression (arrows). (B,B′) At 14 dpci, control hearts display the activation of Raldh2 expression in the endocardium (arrowheads). Epicardial cells surround the injured area (arrows). Raldh2-positive cells invade the post-infarct area (dashed line). (C,C′) At 14 dpci, Alk5/4-i-treated hearts show a similar Raldh2 expression pattern to the control. Scale bar: 300 μm. |
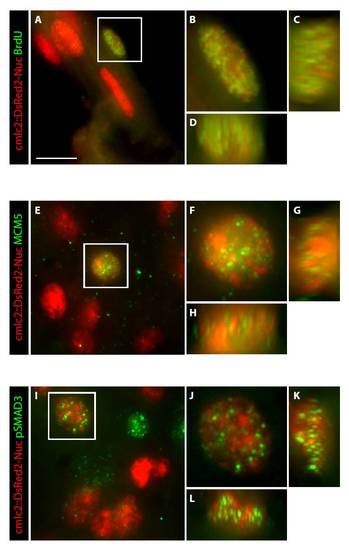
High-resolution images display co-localization of nuclear markers in the cardiomyocytes of regenerating hearts. (A-L) Heart sections of cmlc2::DsRed2-Nuc transgenic fish were immunostained for BrdU (A-D), Mcm5 (E-H) and pSmad3 (I-L). Some cardiac nuclei that are marked by DsRed2-Nuc expression (red) are co-labeled with the antibody staining (green). The images were acquired using an Olympus IX71 confocal microscope equipped with Photometrics Cool SNAP HQ2 camera. (A-D) Regenerating hearts at 10 dpci after 1 day of BrdU treatment. (E-L) Regenerating hearts at 14 dpci. (B,F,J) A higher magnification of the framed nucleus in the left panels shown as a merged file of 60 optical z-sections. (C,G,K) A z-stack of 60 optical sections along the y-axis of the nucleus that is shown in the adjacent left panels. (D,H,L) A z-stack of 60 optical sections along x-axis of the nucleus that is shown in the upper panels. Scale bar: 10 μm. |