
- Title
-
Apoptotic Cells Are Cleared by Directional Migration and elmo1- Dependent Macrophage Engulfment
- Authors
- van Ham, T.J., Kokel, D., and Peterson, R.T.
- Source
- Full text @ Curr. Biol.

Apoptotic Cells Migrate Directionally(A) Time-lapse images showing representative apoptotic cell emerging and moving through the neural tube. Apoptotic cell is marked in green (secA5-YFP, arrowhead), and neural tube tissue is marked by membrane-targeted GFP (mGFP, blue). Arrow and dotted line in last frame (6:20) indicates the path traveled by the apoptotic cell.(B) Images showing secA5-YFP transgenic animals (<30 hpf) treated with a low concentration of camptothecin (50 nM). Neuronal cells are marked with red fluorescent protein. Three-dimensional projections (caudal view) of z stacks were acquired in treated animals at the indicated intervals (apoptotic cells labeled in green, secA5-YFP). First panel (t = 0) is 6 hr after drug treatment when apoptotic cells start to be induced, second panel (t = 3) indicates 3 hr later.(C) Apoptotic cells (inset, arrowheads) emerge throughout the neural tube, indicating that cell death induction is independent of position in the neural tube. Scale bars represent 5 μm (A) and 25 μm (C).(D) Plot shows the path length (total distance) and the displacement (net distance traveled) for dying cells. x = y line indicates optimal directional persistence.(E) Quantification of cells showing net migration outward and inward in the neural tube. Data are represented as mean ± SEM. Also see S1. |
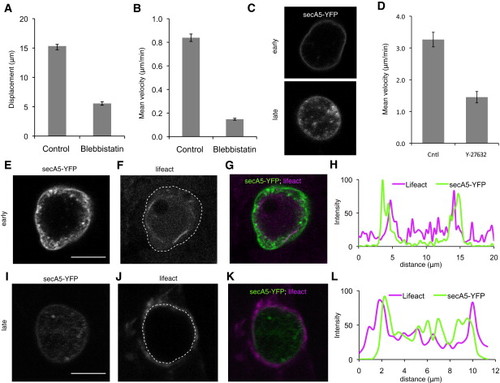
Apoptotic Cells Exhibit Internal Actin Remodeling(A and B) Quantification of displacement and velocity of apoptotic cells showing strong reduction in both parameters in cpt/blebbistatin versus cpt-only treated animals. Animals were treated with camptothecin (cpt) alone (left) or cotreated with cpt and blebbistatin (right). Images of blebbistatin-treated animals show reduced motility compared to animals treated only with cpt.(C) Images of motile, blebbing (early) and round, patchy (late) secA5-YFP+ cells.(D) Quantification of velocity of apoptotic cells in control and Y-27632 (250 μM)-treated animals.(E–H) Representative early apoptotic cell positive for cortical F-actin as indicated by Lifeact fluorescence. This shows high fluorescence inside the apoptotic cell as determined by the boundary of the annexin signal. Note actin bundles within the cell in (F).(I–L) Representative late stage apoptotic cell showing high external Lifeact fluorescence surrounding the apoptotic cell, likely within surrounding cells.(H and L) Quantification of relative fluorescence intensity for secA5-YFP (green) and Lifeact (purple) along a line drawn through the center of the early (H) and late (L) apoptotic cells. Lifeact fluorescence is primarily interior to the annexin signal in early cells and exterior to the annexin signal in late cells. Dotted lines in (F) and (J) indicate outer edge of the cell (as determined by secA5-YFP signal). Scale bars represent 5 μm (E and I). Data are represented as mean ± SEM. |
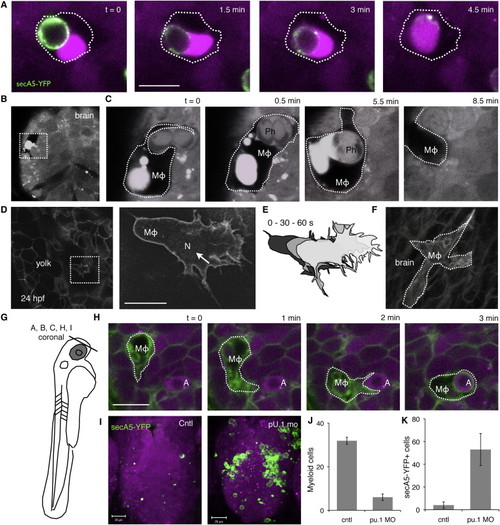
Primitive Macrophages Are Responsible for Engulfment(A) Engulfed secA5-YFP+ cell fuses with fluorescent vacuole in macrophage.(B and C) Large vacuole marked by red fluorescent protein originally expressed in neurons and dark surrounding shape indicates presence of macrophage in the forebrain (rostral view).(D) Image of memGFP transgenic animals showing a large migratory cell on yolk resembling a macrophage. Nuclear Fli1 GFP expression (arrow), a marker for primitive macrophages, is visible in the nucleus (N) of the presumptive macrophage.(E) Cartoon depicts dynamics of the cell.(F) memGFP labeled macrophage near the otic vesicle in the hindbrain at 24 hpf.(G) Drawing of 48 hpf larva, indicating orientation of coronal optical sections shown in (D)–(F), (H), and (I) [38].(H) Images showing a representative example of a macrophage in the forebrain engulfing an apoptotic cell. Nuclear condensation, characteristic of apoptosis, can be distinguished by the darker spot in fluorescently marked apoptotic cell (marked by “A”). Macrophages are indicated by “MΦ.”(I) WT (left, Cntl) and PU.1 morphant (right) brains are marked by transgenic expressed red fluorescent protein in secA5-YFP transgenic animals <60 hpf.(J) Quantification of macrophages on yolk by memGFP in control and PU.1 morpholino-injected animals.(K) Quantification of apoptotic cells in forebrain region shown in (I) in control and PU.1 morphants. Data are represented as mean ± SEM in (J) and (K); p < 0.05. Scale bars represent 10 μm (A, D, and H). Also see Figure S2. |

Elmo1 Controls Engulfment by Primitive Macrophages in Zebrafish(A) Elmo1 deficient macrophages show large vacuoles and lack clear polarity seen in WT macrophages. Image shows a representative elmo1-deficient macrophage in the ventricle.(B) Quantification of macropinocytic macrophages inside the ventricle. Data are presented as mean ± SEM (n = 8).(C) Image showing a macrophage in elmo1 knockdown larvae bound to a mass of secA5-YFP+ apoptotic debris (Movie S4).(D) Quantification of the time from first encounter of secA5-YFP+ cell by a macrophage before being fully engulfed. The time bound for elmo1 MO may be an underestimate because most cells remained unengulfed at the end of the time-lapse observation.(E) Representative thick optical sections (maximal projections of confocal z stacks) showing fluorescent protein only and NTR;fluorescent protein forebrains of 72 hpf animals treated with metronidazole (1 μM). OE, olfactory epithelium; FB, forebrain; V, ventricle.(F) Quantification of macrophages as marked by fluorescent vacuoles and high motility, in animals described in (E). Circles indicate individual animals; black bars indicate mean. Macrophages are indicated by “MΦ” or by blue arrowheads (E), n = 4 animals, error bars represent SEM; p < 0.05. Scale bars represent 10 μm (A) and 50 μm (E). Also see Figure S3. |
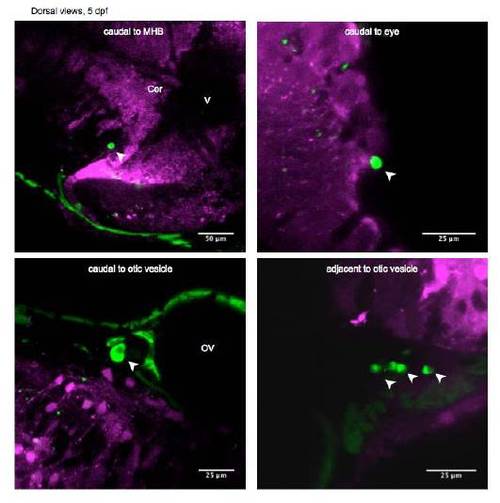
Apoptotic Cells that Migrated out from Different Parts of the Brain in 5 dpf Animals, Related to Figure 1 |

Transgenic Markers for Primitive Macrophages, Microglia and Neutrophils, Related to Figure 3 |

Loss of elmo1 and dock180 Causes Engulfment Defect, Related to Figure 4 |