
- Title
-
Mutations in vacuolar H(+)-ATPase subunits lead to biliary developmental defects in zebrafish
- Authors
- Eauclaire, S.F., Cui, S., Ma, L., Matous, J., Marlow, F.L., Gupta, T., Burgess, H.A., Abrams, E.W., Kapp, L.D., Granato, M., Mullins, M.C., and Matthews, R.P.
- Source
- Full text @ Dev. Biol.
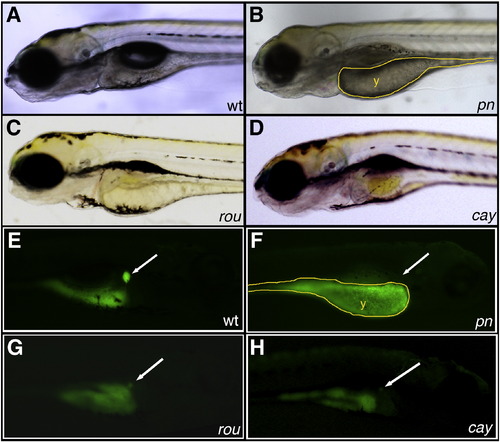
Novel mutants with abnormal PED-6 uptake. (A–D) Left lateral views of live 5 dpf wild-type (A, wt), pekin (B, pn), rouen (C, rou), and cayuga (D, cay) larvae. pn demonstrates global hypopigmentation, underutilized yolk (y), absent swim bladder and some brain edema. (E–H) Right lateral views of the same 5 dpf larvae after PED-6 uptake, demonstrating normal intensity of the gallbladder in wt (E, white arrow), but absent gallbladders in the mutants (F–H, white arrows). PHENOTYPE:
|
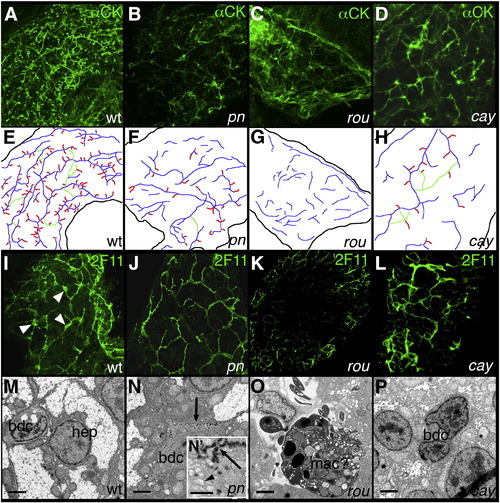
Intrahepatic biliary defects in novel mutants. (A–D) Confocal projections of whole-mount cytokeratin immunostaining of livers from 5 dpf wild-type (A, wt), pekin (B, pn), rouen (C, rou), and cayuga (D, cay) larvae, schematized in (E–H). The typical wt pattern is depicted in (A) and schematized in (E), demonstrating a complex latticework. In contrast, the staining pattern of pn (B, F) demonstrates shorter ducts with fewer interconnections. The staining pattern of rou (C, G) demonstrates an absence of recognizable ducts. The cytokeratin staining pattern of cay (D, H) demonstrates short non-interconnected ducts, with some terminal ductules. (I–L) Confocal projections of whole-mount 2F11 immunostaining of livers from 5 dpf wt (I), pn (J), rou (K), and cay (L) larvae. 2F11 stains bile duct cell bodies (white arrowheads) and proximal ducts, as demonstrated in wt (I). The 2F11 pattern of pn demonstrates fewer ducts, with smaller bile duct cells. There are no apparent bile duct cells in 2F11 stainings of rou (K), and cay (L) is similar to wt. (M–P) Electron micrographs of livers from 5 dpf wt (M), pn (N), rou (O), and cay (O) larvae. In (M), the wt hepatocyte (hep) and bile duct cell (bdc) are depicted. In contrast, the bdc in pn (N) contains an accumulation of electron dense material (black arrow) at the periphery of the cell. The inset (N2) demonstrates that these bodies have a striped appearance, and the dilated vesicles (black arrowhead) are also apparent. The cell in rou (O) is most likely a macrophage (mac), in the space normally occupied by bile duct cells. In contrast, the bdc of cay (P) appears close to normal, but with nuclei that are modestly enlarged relative to the cytoplasm when compared to wt (M), and with an appearance more closely resembling the hep nucleus. Scale bars in (M–P) 500 nm, N2 also 500 nm. |
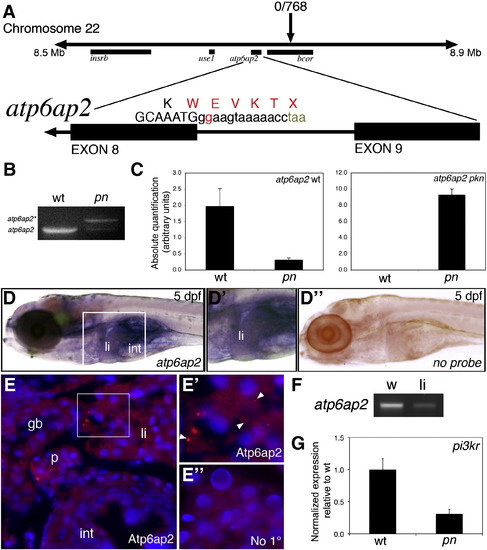
Mapping and genetic characterization of pn. (A) Schematic of mapping around the pn locus. A region of interest on chromosome 22 was identified as depicted, with a zero recombinant marker in the bcor gene. A splice donor site mutation following exon 8 of atp6ap2 was detected in pn mutants, which would result in the depicted sequence. (B) PCR of the wild-type (wt) and pn splice products, demonstrating the presence of the higher band (atp6ap2*), corresponding to the read-through product. (C) Quantitative PCR of the wt and pn atp6ap2 splice products, demonstrating a 10 × reduction in the wt product in pn, and a very large increase in the amount of the mutant transcript in pn. (D) In situ hybridization of atp6ap2 at 5 dpf demonstrates liver (“li”) and intestinal (“int”) expression of atp6ap2, shown in higher magnification in D2. Compare to (D3), which is a similarly processed 5 dpf larva without atp6ap2 riboprobe, with no specific staining. (E) Immunostaining of Atp6ap2 in 5 dpf cross-sections demonstrates staining in liver (“li”), intestine (“int”), pancreas (“p”), and gallbladder (“gb”). The area within the white rectangle is shown in E2, demonstrating punctate staining (white arrowheads), consistent with a vesicular localization, within the liver. (E3) Liver section from a 5 dpf larva processed similarly but without primary antibody, at the same magnification as (E2), showing no punctate staining. (E), (E2) and (E3) are counterstained with DAPI to show nuclei. (F) PCR of atp6ap2 from 5 dpf whole larvae (w) and from livers (li) isolated from 5 dpf larvae, showing expression of atp6ap2. (G) Quantitative PCR demonstrating a 5 × decrease in pi3kr1 expression, a gene regulated by Atp6ap2 via PLZF. EXPRESSION / LABELING:
|

Additional defects in pn larvae. (A–D) Confocal projections of whole-mount cytokeratin immunostaining of livers from 4 dpf wild-type (A, wt) and pekin (B, pn) larvae, demonstrating abnormalities at this earlier stage. Ducts are short and demonstrate few if any connections. These abnormalities are schematized in (C–D). (E–F) Hematoxylin and eosin stainings of cross-sections of 5 dpf wt (E) and pn (F) larvae, demonstrating that at this resolution the liver of a pn larva appears normal. (G–H) Hematoxylin and eosin stainings of the eye from a 5 dpf wt (G) and pn (H) larva. Note the ordered appearance of the cell layers in the wt eye, including the inner ganglionic (ig), outer ganglionic (og), retinal (r), and retinal pigmented epithelial (rpe) layers. In contrast, cells in these layers are disordered in pn, in particular in the retinal layer, which is difficult to distinguish from the og layer. The rpe is also poorly formed in pn. (I–L) Electron micrographs of pancreas (I–J) and enterocytes (K–L) from wt (I, K) and pn (J, L). Note that the presence of numerous zymogen granules (zg) in wt pancreas is absent in pn, although there are small structures that may represent poorly formed zg (black arrow). The Golgi (g) in the pn enterocyte (L) appears dilated relative to the Golgi of wt (K). n, nucleus. Scale bars 500 nm. |
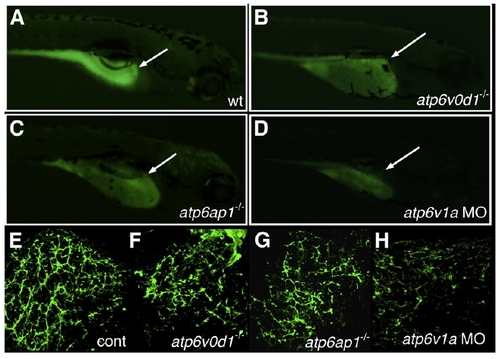
Intrahepatic biliary defects in other V-H+-ATPase mutants. (A–D) Right lateral views of 5 dpf larvae after administration of the fluorescent lipid reporter PED-6. (A) Control larva demonstrates normal gallbladder intensity (white arrow). (B) 5 dpf atp6v0d1-/- mutant, (C) 5 dpf atp6ap1-/- mutant, and (D) 5 dpf atp6v1a morpholino (MO)-injected larvae all demonstrate a decrease or lack of gallbladder fluorescence (white arrows). (E–H) Confocal projections of cytokeratin immunostaining of 5 dpf liver from control (E), atp6v0d1-/-, atp6ap1-/-, and atp6v1a MO-injected larvae. The abnormal cytokeratin pattern in (F–H) has similarities to the pattern noted in pn, with fewer ducts overall and focal areas of ectatic ducts. PHENOTYPE:
|
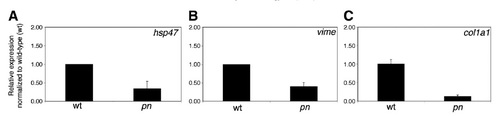
Changes in fibrogenic gene expression in pn. Quantitative real-time PCR on pn for hsp47 (A), vimentin (vime) (B), and collagen I(α)I (col1a1) (C). There is a significant decrease (pb0.03, pb0.05, pb0.01) for all the three genes. QPCR results for the other V-H+-ATPase gene mutants and morphants show minimal changes and are depicted in Supplemental Fig. 5. EXPRESSION / LABELING:
|

Additive effect of vps33b and atp6ap2 inhibition. (A) Gallbladder PED-6 uptake in 5 dpf control larvae (cont), larvae injected with a low dose of atp6ap2 morpholino (MO), larvae injected with a low dose of vps33b MO, and larvae injected with a combination of the low dose MOs. The number of larvae with faint gallbladders was not significantly different between either of the MOs alone compared to control, but the number of larvae with faint gallbladders after injection of the combination of MOs was significantly increased compared to control (p < 0.01) and to either of the MOs alone (p < 0.01 for atp6ap2, p < 0.05 for vps33b). (B–E) Confocal projections of cytokeratin immunostaining from 5 dpf larvae corresponding to the conditions depicted in the graph in (B), showing control (B, cont), low-dose atp6ap2 MO (C), low-dose vps33b MO (D), and the combination of the two MOs in low dose (E). Note that (C) and (D) are similar to (B), while (E) more closely resembles the pn defects shown above. Samples depicted in B–E are representative of pooled samples of all PED-6 classifications. PHENOTYPE:
|
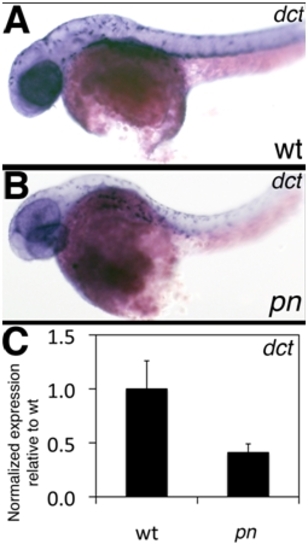
Expression of dct in pn. (A–B) Left lateral views of in situ hybridizations of 2 dpf wt (A) and pn (B) larvae for dct, a marker of melanocytes. Note that the wt and pn expression patterns are similar. (C) QPCR of dct expression at 5 dpf, showing a decrease in dct expression in pn. |

Lack of changes in the early digestive organ marker foxa3 in atp6ap2 morphants. Whole-mount in situ hybridizations of 36 hpf embryos using riboprobe directed against foxa3, which recognizes foregut derivatives. There is staining of liver bud (lb), pancreatic bud (pb) and foregut (fg) in both controls (A and C, cont) and atp6ap2 MO-injected (B and D) that appears similar. Two examples of each, control and MO-injected, are depicted. |
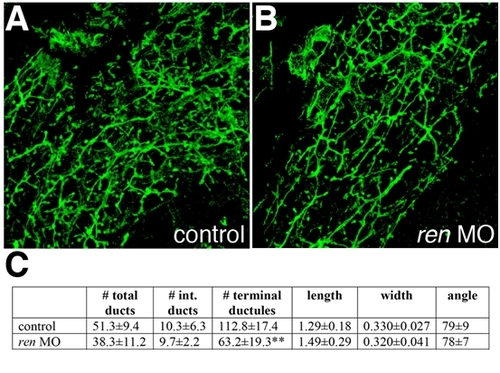
Normal biliary anatomy in ren morphants. (A–B) Confocal projections of cytokeratin immunostaining of livers of 5 dpf cont (A) and ren MO (B)-injected larvae, which appear fairly similar. (C) Quantification of duct properties, including total number of ducts, number of interconnecting ducts, number of terminal ductules, duct length, width, and angle. There is a significant difference (**p d 0.005) only in the number of terminal ductules. Note that these differences are considerably more subtle than those in the V-H+-ATPase mutants and morphants (Fig. 5 and Table 1). PHENOTYPE:
|
Reprinted from Developmental Biology, 365(2), Eauclaire, S.F., Cui, S., Ma, L., Matous, J., Marlow, F.L., Gupta, T., Burgess, H.A., Abrams, E.W., Kapp, L.D., Granato, M., Mullins, M.C., and Matthews, R.P., Mutations in vacuolar H(+)-ATPase subunits lead to biliary developmental defects in zebrafish, 434-444, Copyright (2012) with permission from Elsevier. Full text @ Dev. Biol.