
- Title
-
Identification of DreI as an Antiviral Factor Regulated by RLR Signaling Pathway
- Authors
- Li, S., Sun, F., Zhang, Y.B., Gui, J.F., and Zhang, Q.Y.
- Source
- Full text @ PLoS One
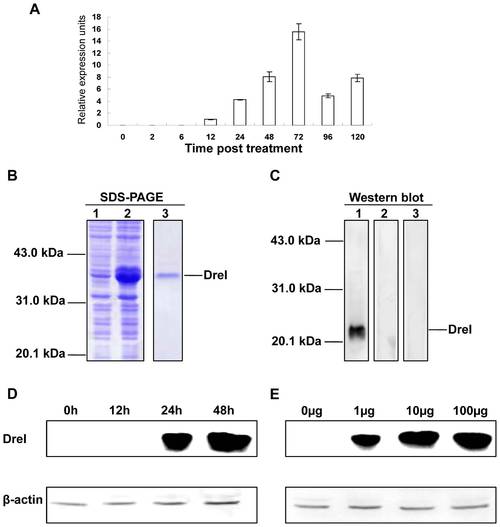
Inducible expression pattern of DreI. (A) ZFL cells seeded on 6-well plates overnight were transfected with 2 μg/ml poly I:C for 2, 6, 12, 48, 72, 96, and 120 h. Then total RNAs were extracted to examine the expression level of DreI transcripts by real-time PCR. β-actin was introduced as endogenous control. (B) Prokaryotic expression of the fusion protein DreI-His and generation of anti-DreI polyclonal antibody. Lane 1: lysate of normal bacteria; lane 2: lysate of IPTG-induced bacteria; lane 3: the purified protein by Ni2+-NTA affinity chromatography. (C) Transfection of ZFL cells with 2 μg/ml poly I:C for 48 h, the lysate was immunoblotted by polyclonal anti-DreI antiserum (lane 4), normal rabbit serum (lane 5) or anti-DreI antiserum pre-adsorbed with purified prokaryotic protein (lane 6). (D) ZFL cells were stimulated with 2 μg/ml poly I:C plus 4 μl/ml Lipofectamine 2000 for 12, 24, and 48 h, then lysed and detected by anti-DreI antiserum. β-actin served as an internal control. (E) For dose-dependent analysis, ZFL cells were treated with 1, 10, and 100 μg/ml poly I:C for 24 h. β-actin served as an internal control. |
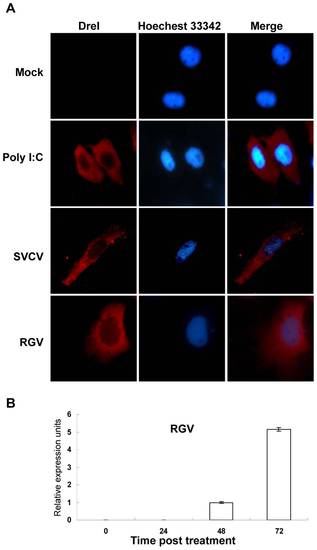
Immunofluorescence localization of DreI. (A) ZFL cells seeded on microscope cover glass in 6-well plates were stimulated with 2 μg poly I:C for 24 h, or infected with 10 TCID50 of RGV or SVCV per well for 72 h, then the cells were fixed, permeabilized, and immunoblotted with anti-DreI antiserum at 4°C overnight. The cell monolayers were further stained with Alexa Fluor 546 anti-rabbit antibody and Hoechest 33342, then examined using a Leica DM IRB fluorescence microscope. Mock-infected ZFL cells were used as a control. The red staining represented DreI protein signal and the blue indicated nucleus region. Magnification 100 (oilimmersion objective). (B) ZFL cells were infected with RGV at a dose of 10 TCID50 and were sampled at the indicated times. The relative transcript level of DreI was detected by real-time PCR and normalized to the expression of β-actin. Error bars represent SDs obtained by measuring each sample in triplicates. |