
- Title
-
Mutation of pescadillo Disrupts Oligodendrocyte Formation in Zebrafish
- Authors
- Simmons, T., and Appel, B.
- Source
- Full text @ PLoS One
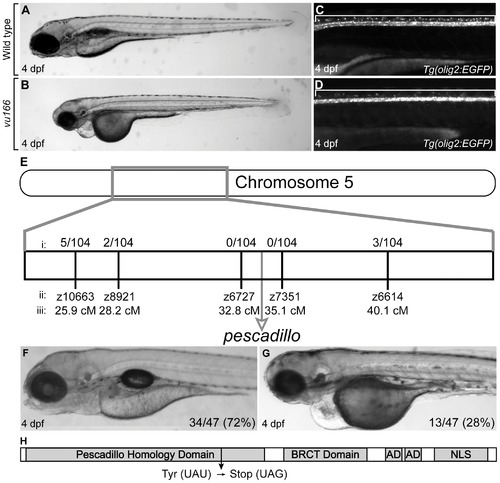
Characterization and genetic mapping of the vu166 mutant allele. Lateral views of 4 dpf wild-type (A,C) and vu166 -/- larvae (B,D). EGFP expression revealed oligodendrocytes in dorsal spinal cord of wild-type Tg(olig2:EGFP) larva (C, bracket). Fewer dorsal EGFP+ cells were evident in a vu166 -/- larva (D). Bulked segregant analysis revealed that the vu166 allele links to chromosome 5 (E). The recombination frequencies (i) at various microsatellite markers (ii) at known locations (iii) along chromosome 5 show that the mutation lies near the pescadillo (pes) gene locus. The vu166 allele failed to complement the previously characterized peshi2 mutant allele, producing phenotypically wild-type (F) and mutant (G) larvae in a 3:1 ratio. The Pes gene product (H) contains a highly conserved Pescadillo Homology domain, a BRCA1 C-terminal domain, two Acidic Domains (AD), and a Nuclear Localization Sequence (NLS). Sequencing of pes cDNA obtained from vu166 mutants revealed a single base pair mutation that creates a premature stop codon predicted to prematurely truncate the protein. |

Distribution of oligodendrocyte lineage cells in wild-type and pesvu166 mutant larvae. Transverse sections through spinal cords of 4 dpf wild-type (A) and pesvu166 -/- (B) larvae carrying the Tg(olig2:EGFP) reporter and processed for Sox10 immunohistochemistry. (A) Wild type spinal cord section showing normal number and distribution of dorsal (arrows) and ventral (arrowheads) olig2+, Sox10+ oligodendrocytes. Dashed line marks position of pMN precursor domain. Anti-Acetylated Tubulin staining (blue) marks axon-rich white matter region of spinal cord. Dorsal olig2+, Sox10+ oligodendrocytes occupied white matter. (B) pesvu166 -/- spinal cord section. Dorsal olig2+, Sox10+ oligodendrocyte (arrow) was located in gray matter region, medial to the white matter region. (C,D) Quantification of oligodendrocytes in the dorsal, ventral, gray matter, and white matter spinal cord regions at 3 and 4 dpf. Ten sections from ten larvae of each genotype were counted. Scale bar represents 30 μm. Asterisk (*) indicates pj0.05 by Student′s T-test. EXPRESSION / LABELING:
PHENOTYPE:
|
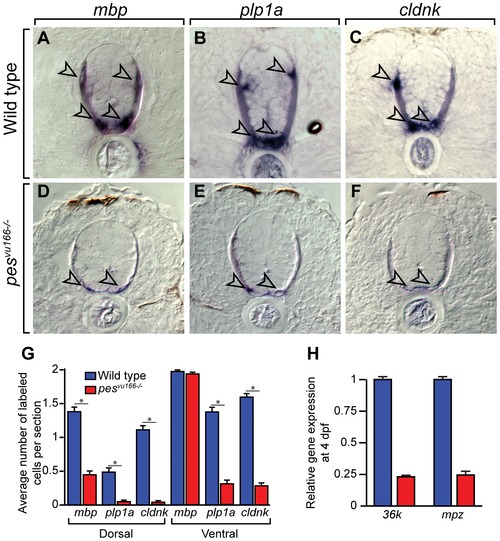
Loss of pes function reduces oligodendrocyte gene expression. Transverse sections through spinal cords of 4 dpf wild-type (A–C) and pesvu166 -/- (D–F) larvae processed for in situ RNA hybridization. Arrowheads indicate oligodendrocytes. Reaction products are greatly reduced in mutant relative to wild type. (G) Average number of labeled cells in the dorsal and ventral spinal cord. Ten sections from ten larvae of each genotype were counted. Asterisk (*) indicates pj0.05 by Student′s T-test. (H) Relative expression levels of the CNS myelin genes mpz and 36k measured by quantitative PCR. |

Markers of cell cycle activity are significantly increased in the spinal cords of pesvu166-/- embryos. (A–H) Transverse sections through the spinal cords of 3 dpf (A,B), 4 dpf (C,D) and 2.5 dpf (E–H) larvae processed for immunohistochemistry. (A,C) Wild type spinal cord (dashed line) section showing BrdU+ (arrows) and BrdU- (arrowheads) olig2+, Sox10+ OPCs. (B,D) pesvu166 -/- spinal cord sections. OPCs did not incorporate BrdU but numerous cells lining the central canal and medial septum were BrdU+. (E,F) Representative spinal cord sections showing the M-phase marker PH-3. (G,H) Representative spinal cord sections showing TUNEL labeling (red) to mark apoptotic cells. DAPI labeling (blue) marks cell nuclei. (I) Quantification of the change in total BrdU+ and PH-3+ cells between wild-type and pesvu166 -/- spinal cords. (J) Quantification of DAPI+ and TUNEL+ cells in wild-type and mutant spinal cords. Asterisk (*) indicates pj0.05 by Student′s T-test. |

Loss of pes function disrupts progression of spinal cord cells through the cell cycle. (A) The time required to progress from S-phase to M-phase in the spinal cord is shown by the ratio of PH-3+/BrdU+ to total PH-3+ cells at the indicated time points after a BrdU pulse. (B) The length of S-phase in the spinal cord is shown by the ratio of BrdU+/EdU+ cells to total BrdU+ cells at the indicated time points after a BrdU pulse. Wild-type (blue) and pes166 -/- (red) are shown. (C,D) Transverse sections through spinal cords of 4 dpf wild-type (C) and mutant (D) larvae processed for in situ RNA hybridization showing the expression of the neural precursor marker sox2. |

Loss of pesvu166 function results in nonautonomous defects in oligodendrocyte morphology and axogenesis. (A–G) Lateral views of spinal cords in 3 dpf larvae. Expression from Tg(nkx2.2a:mGFP) reporter marks oligodendrocytes and axons. (A) Oligodendrocyte with normal axon wrapping morphology (arrows) in wild-type larva. (B) Oligodendrocyte with disorganized membrane morphology (arrowhead) and no evidence of axon wrapping in pesvu166 -/- larva. (C) Genetically wild-type oligodendrocyte transplanted into a pesvu166 -/- larva had abnormal membrane extensions and no axon wrapping. (D) Genetically mutant oligodendrocyte transplanted into a wild-type larva wrapped axons normally. (E) Axon in wild-type larva. (F) Axon in pesvu166 -/- larva showing wandering trajectory, abnormal forking and growth cone collapse (asterisks *). (G) Genetically mutant axon transplanted into a wild-type larva had normal trajectory and morphology. (H,I) Transverse sections through the spinal cord of 3 dpf wild-type (H) and pesvu166 -/- (I) larvae showing Zrf-1+ radial glia. EXPRESSION / LABELING:
PHENOTYPE:
|