
- Title
-
LAR Receptor Tyrosine Phosphatases and HSPGs Guide Peripheral Sensory Axons to the Skin
- Authors
- Wang, F., Wolfson, S.N., Gharib, A., and Sagasti, A.
- Source
- Full text @ Curr. Biol.
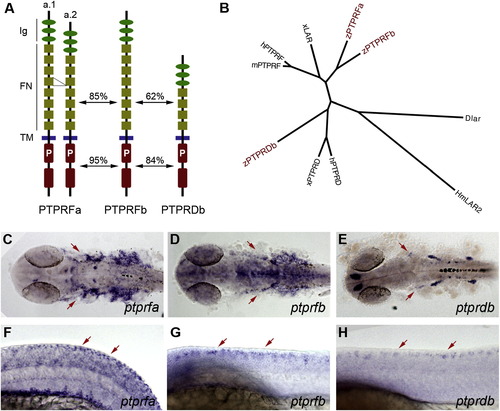
LAR Family Genes Are Expressed in Developing Somatosensory Neurons (A) Domain structure of zebrafish LAR family proteins. Two alternative splice forms of PTPRFa, differing by one fibronectin III repeat, were identified. Amino acid identities between the ectodomains and cytoplasmic domains separately are indicated. Ig, immunoglobulin-like domain; FN, fibronectin III repeat; TM, transmembrane domain; P, catalytic phosphatase domain. (B) Phylogenetic relationship between LAR family proteins. Zebrafish PTPRFa and PTPRFb clustered with the PTPRF family, whereas zebrafish PTPRDb was closest to other PTPRD family members. D, fruit fly; Hm, leech; h, human; m, mouse; x, Xenopus; z, zebrafish. ClustalW 1.81 was used to compare sequences, and FigTree v1.0 was used to create the tree. (C–H) Whole-mount in situ hybridization for LAR family members. (C)–(E) show dorsal views, rostral left, 28 hpf; (F)–(H) show lateral views, dorsal up, anterior left; embryo in (F) is 20-somite stage, and embryos in (G) and (H) are 24 hpf. Arrows indicate expression in trigeminal and RB sensory neurons. See also Figure S1. EXPRESSION / LABELING:
|

Knocking Down ptprfa and ptprfb Caused Skin Innervation Defects (A) Schematic showing the relationship between skin and axons. (B–C) Confocal projections of lateral views of WT (B) and ptprfa/ptprfb double morphant (C) embryos. 90° rotations of the images in (B) and (C) provide cross-section views of these embryos (B2–C2). Zebrafish larvae carried two transgenic reporters—sensory:GFP to visualize somatosensory neurons and krt4:dsRed to visualize the skin. Arrowhead indicates axons innervating internal tissues. Scale bar represents 100 μm. (D) Frequency of embryos with axons below the skin in a defined region of the trunk. Knocking down ptprfa or ptprfb alone caused mild skin innervation defects compared with embryos injected with an equivalent amount of control morpholino (9.7%). However, axons grew below the skin in 78.6% of ptprfa-MO1/ptprfb-MO1 double morphants and 59.2% of ptprfa-MO2/ptprfb-MO2 double morphants, which was significantly (p < 0.001) more than controls. Data was analyzed with two-sided Fisher′s exact test and computed with R (http://www.r-project.org). See Supplemental Information for details of statistical analysis. Con, control; MO, morphants; ***p < 0.001. See also Figure S2 and mmc2VIDEO and mmc3VIDEO. |

Rohon-Beard Neurons Expressing Dominant-Negative LAR Family Proteins Failed to Innervate Skin (A) A sensory neuron-specific promoter was used to drive the GAL4-VP16 activator [37]. Putative dominant-negative (DN) versions of each gene, created by replacing their cytoplasmic domains with GFP, were expressed under the control of the Gal4 upstream activation sequence (UAS). Coinjection of these transgenes at the one-cell stage caused transient mosaic expression in somatosensory neurons. (B) Frequency of RB neurons expressing indicated transgenes with peripheral axons below the skin. Number of neurons are listed at the top of each bar; number of fish in parentheses. Data were analyzed with two-sided Fisher′s exact test and computed with R. ***p < 0.001; **p < 0.01; NS, not significant. Defects were scored as “mild” if one or a few axon branches were below the skin, “moderate” if many axon branches were below the skin, and “severe” if the entire peripheral arbor was below the skin. (C–F) Confocal projections of lateral views of RB neurons expressing GFP only (WT) (C), PTPRFa.1-DN (D), PTPRFb-DN (E), and PTPRFb-C1550S (F). Ninety degree rotations of the images in (C)–(F) provide cross-section views of embryos (C2–F2), respectively. krt4:dsRed was used to visualize the skin. Arrowheads indicate axons innervating internal tissues; arrow indicates axons innervating the contralateral side of the body. Scale bar represents 100 μm. (G–H) Higher magnification of lateral view RB neurons expressing GFP only (WT) (G), and PTPRFb-DN (H). Ninety degree rotations are shown in (G2–H2). Star indicates axon arborizing just beneath the skin. Scale bar represents 20 μm. See also Figure S3. |
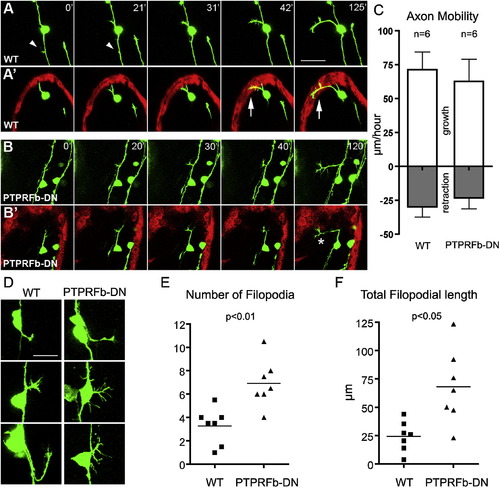
Peripheral Axons of PTPRFb-DN-Expressing RB Neurons Exhibited Axon Guidance Defects at Early Developmental Stages (A–B) Representative still images from a time-lapse confocal series showing initial peripheral axon outgrowth in WT (A) and PTPRFb-DN-expressing (B) RB neurons. The time-lapse series began at <18 SS and shows a dorsal view of the embryo. (A) and (B) show projections of complete image stacks of GFP-expressing axons; (A2) and (B2) show 5–7.5 μm optical sections of GFP-expressing axons and dsRed-expressing skin. WT peripheral axons innervated skin (A2), whereas PTPRFb-DN peripheral axons grew just below the skin (B2). Arrows indicate peripheral axon colocalization with keratinocytes. * indicates an axon branching beneath the skin. Arrowheads indicate transient filopodia from the central projection. Scale bar represents 50 μm. (C) Quantification of axon mobility during initial stages of peripheral axon outgrowth. Peripheral axons of WT and PTPRFb-DN-expressing RB neurons grew and retracted at similar rates. Error bars represent SEM. (D) Three representative peripheral axons each of WT and PTPRFb-DN-expressing RB neurons. WT axons had not yet reached the skin. Axons of PTPRFb-DN expressing RB neurons had more filopodia and did not enter the skin during the imaging period. Scale bar represents 25 μm. (E) The peripheral axons of PTPRFb-DN-expressing RB neurons had significantly (p < 0.01) more filopodia than axons of WT neurons. (F) The total filopodial length of axons in PTPRFb-DN expressing RB neurons was significantly (p < 0.05) longer than in WT axons. All data were analyzed with two-tailed t test. See also mmc4VIDEO and mmc5VIDEO. |
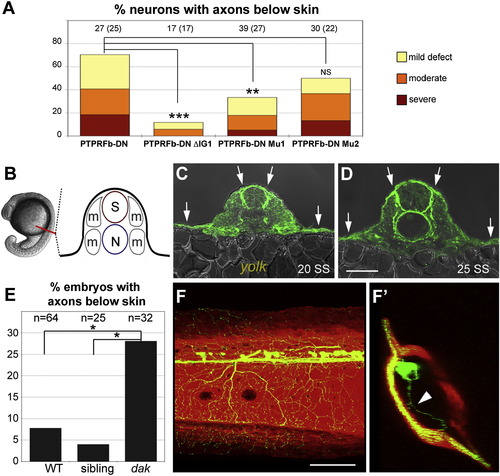
HSPG Binding to LAR Proteins Is Likely Important for Skin Innervation (A) Disrupting the first Ig domain significantly reduced skin innervation defects caused by expressing PTPRFb-DN. Deleting Ig1 or mutating a proteoglycan-binding-site (Mu1) in PTPRFb-DN significantly reduced skin innervation defects (11.8% and 33.3%, respectively). The number of neurons is listed at the top of each bar; the number of fish is listed in parenthesis.(B) Diagram of <20 SS zebrafish embryo cross-section. Red line indicates position of cross-section. S, spinal cord; N, notochord; m, muscle. C and D) Cross-sections of anti-HS staining at 20 and 25 SS. HSPGs were enriched in basement membranes around the spinal cord, notochord, and skin. Arrows indicate high levels of anti-HS staining in the skin. Scale bar represents 50 µm. (E) Frequency of embryos with peripheral axons below the skin in a defined region of the trunk (see Figure 2). Peripheral axons in this region were found below the skin in 28.1% of dackel homozygous mutant embryos, which was significantly higher than in their nonmutant siblings (4.0%). (F) Lateral view of 3 dpf dackel mutant larva harboring krt4:dsRed and sensory:GFP transgenes. (F2) Ninety degree rotation of image in (F). Arrowhead indicates axon innervating internal tissue. All data analyzed with two-sided Fisher′s exact test and computed with R. ***p < 0.001; **p < 0.01; *p < 0.05. Scale bar represents 100 μm. See also Figure S4. PHENOTYPE:
|
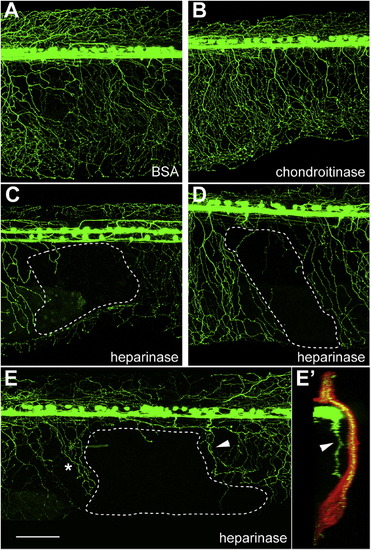
Peripheral Axons Avoid Heparinase III-Injected Areas(A–E) Lateral views of 2 dpf embryos injected with BSA (A) or chondroitinase ABC (B). These embryos did not exhibit obvious defects in RB neuron projections. However, RB neuron peripheral axons often did not innervate heparinase III-injected areas (C–E), suggesting that peripheral axons prefer regions with higher levels of heparan sulfate.(E2) A 90° rotation of (E). Arrowheads in (E) and (E2) indicate an axon that innervated internal tissue. * indicates another axon with a branches beneath the skin. White dotted lines indicate under-innervated areas. Scale bar represented 100 μm. See also Figure S5 and mmc6VIDEO and mmc7VIDEO. |

ZFIN is incorporating published figure images and captions as part of an ongoing project. Figures from some publications have not yet been curated, or are not available for display because of copyright restrictions. PHENOTYPE:
|

RT-PCR Confirms the Efficacy of Morpholinos, Related to Figure 2 The majority of RT-PCR products from ptprfa-MO1 or ptprfb-MO1 morphant embryos were shorter than those from their uninjected siblings, indicating deletions in the mRNAs. gapdh (glyceraldehyde-3-phosphate dehydrogenase) was used as a control for RT-PCR. uninj.: uninjected |
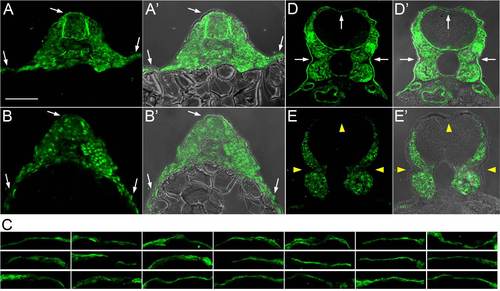
Heparan Sulfate Staining in dackel Mutants and Siblings, Related to Figure 5 Cross-sections of anti-heparan sulfate (HS)-stained 18 to 20 somite-stage (SS) embryos (A-C) and 3 dpf larvae (D-E). At 18-20 SS, there was no morphological difference between dackel mutants and wildtype embryos. 23 embryos were stained and imaged, 5-6 of which were expected to be dackel mutants. Widespread HS staining was seen in all 23 embryos. Only one embryo appeared to have less extracellular HS staining (B) compared to others (e.g., A), but HS staining was nonetheless clearly seen around the yolk, which is surrounded by skin. This staining was not seen in controls lacking primary antibodies (not shown). (C) Representative regions of skin around the yolk from the other 21 embryos. (D) At 3 dpf, non-mutant siblings of dackel mutants displayed prominent staining in basement membranes, but HS staining was not detectable in basement membranes in dackel mutants (E). Arrows indicate skin, arrowheads indicate the absence of HS from skin in 3 dpf dackel mutants. n=6 for each 3 dpf group. Scale bar indicates 50μm. |

Peripheral Axons Avoid Heparinase III-Injected Areas, Related to Figure 6 Representative still images from time-lapse confocal series (Movie S5 and Movie S6) showing peripheral axon outgrowth in BSA- (A) and heparinase III-injected (B) embryos. Yellow dotted lines indicate ventral edge of the embryos. Arrows indicate axons that appear to be encountering the heparinase-injected region and fail to grow ventrally, instead branching or turning. |