
- Title
-
Zebrafish Models for Dyskeratosis Congenita Reveal Critical Roles of p53 Activation Contributing to Hematopoietic Defects through RNA Processing
- Authors
- Zhang, Y., Morimoto, K., Danilova, N., Zhang, B., and Lin, S.
- Source
- Full text @ PLoS One

Molecular and phenotype analysis of dkc1 morphant and nola1 retroviral insertion mutatant of zebrafish. (A) Splicing MO targeting dkc1 sequence caused the inclusion of intron 4 into mRNA (a). Semi-quantitive PCR data showed an increase of 1.5 kb in the PCR product in dkc1 morphants (b). According to Real Time PCR result, expression of dkc1 was diminished by more than 90% when high dose (15 ng) of MO was injected (c). Pictures of embryos at 3 dpf (d and e) and 5 dpf (f and g) showed smaller eyes and smaller head (red arrows in d, e, f and g) in dkc1 morphants. Compared to wild type embryos, dkc1 morphants developed edema, and had fewer red blood cells (red arrowhead in d, e, f and g). d and f: wild type controls; e and g: dkc1 morphants. (B) A retroviral insertion in exon1 of the nola1 gene led to the phenotype of smaller eyes, smaller head, and cardiac edema in nola1 homozygous mutant. Red arrow indicated the smaller eyes and smaller head, and red arrowhead showed edema in nola1 homozygous mutant at 3 dpf (a and b) and 5 dpf (c and d). Microinjection of nola1 mRNA (f), but not eGFP mRNA (e) can rescue the mutant phenotype of nola1 homozygous mutants at 5 dpf (red arrow and arrowhead in e and f). a and c: wild type siblings; b, d, e and f: nola1 homozygous mutants. Expression of nola1 was reduced more than 90% in nola1 homozygous mutants (g). All the pictures of embryos are lateral view with anterior to the left. PHENOTYPE:
|
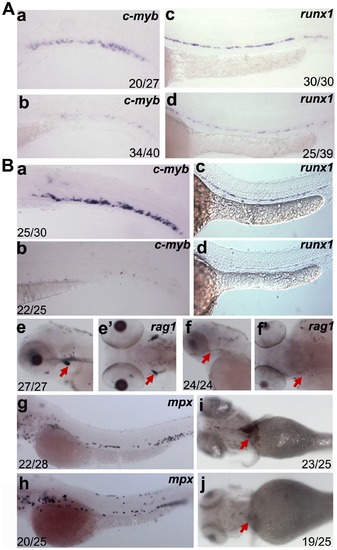
Analysis of hematopoietic defects in dkc1 and nola1 deficiency. (A) Expression of HSC marker genes was decreased in dkc1 morphants. C-myb expression at 3 dpf (a and b); runx1 expression at 30 hpf (c and d). (B) Number of HSC (a, b, c and d) and red blood cells (red arrow in i and j) at 4 dpf were significantly reduced in nola1 mutants. C-myb expression at 3 dpf; runx1 expression at 30 hpf. Granulocytes, marked by mpx, weren′t affected or slightly less in nola1 mutants at 3 dpf (g and h), while expression of rag1, a marker of lymphoid cells, almost disappeared in nola1 mutants at 4 dpf (red arrow in e–f2). A a–d, B a–d, e, f, g and h are lateral view with anterior to the left, e2 and f2 are dorsal view with anterior to the left, and i and j are ventral view with anterior to the left. |

Activation of p53 pathway and rescue of hematopoietic defects in zebrafish dkc1 and nola1 deficiency. (A) and (C) Expression of genes of p53 pathway was up-regulated in both dkc1 morphant (A) and nola1 mutant (C). Expression level of wild type embryos of related genes was normalized as 1.0. (B) Knockdown of p53 by injection of p53 MO rescued the reduction of HSC in dkc1 morphants (compare c with e, d with f). C-myb expression at 3 dpf (a, c and e); runx1 expression at 30 hpf (b, d and f). (D) Red blood cells were restored in nola1 and p53 double mutatant embryos (red arrow in a–d). 25 embryos at 4 dpf were examined for each group. And the results shown here were representative for three independent experiments. EXPRESSION / LABELING:
|

Analysis of telomere maintenance and rRNA processing in zebrafish dkc1 and nola1 defeicency. (A) TRAP Assay results showed no difference between dkc1 morphants, nola1 mutants and control embryos at 3 dpf when the mutant phenotype onset (a and b). (c) We injected dkc1 MO into Tg(c-myb:GFP) fish. GFP-positive HSC were isolated by cell sorting (FACS) at 3 dpf. GFP positive (GFP+) and negative (GFP-) cells from control embryos (0 ng MO) and dkc1 morphants (15 ng MO) were subjected to TRAP Assay. IC: Internal control; -ctrl: only lysis buffer but no embryo extracts added group. (B)Analysis of RNA processing showed that reduction of 18 S rRNA in dkc1 morphant (a and b) at 48 hpf and in nola1 mutant (c and d) at 3 dpf, but slight change or no change of 28 S rRNA. The average fold changes of percentage of 18 S rRNA and 28 S rRNA are represented by the bar graphs. WT: wild type control; MO: dkc1 morphant; nola1-/-: nola1 mutant. ** indicates very significant changes at p<0.01, and * indicates significant changes at p<0.05 on the basis of independent Student t tests. PHENOTYPE:
|
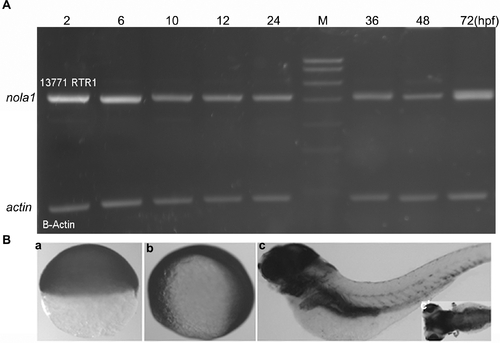
Temporal and spatial expression pattern of nola1. (A) Semi-quantitative PCR result showed that nola1 was expressed from about 2 hpf. (B) Non-specific expression of nola1 was detected during the early stage of zebrafish development (a, b). Afterward, nola1 expression was mainly detected in the brain and some inner organs. a: nola1 expression at 7 hpf; b: nola1 expression at 10 hpf; c and c2: nola1 expression at 4 dpf. a, b: lateral view; c: lateral view with anterior to the left; c2: dorsal view with anterior to the left. |

Nola1 is highly conserved among different species. (A) Analysis result using Clustal W software showed protein sequences of nola1 from different species have high similarity. (B) Synteny analysis data show the evolutionary conservation of nola1. (C) Microinjection of GAR1 mRNA can partially rescue the mutant phenotype of nola1 homozygous mutants at 5 dpf (red arrow and arrowhead in a, b and c). a: wild type sibling; b: nola1 homozygous mutant; c: nola1 homozygous mutant injected with human GAR1 mRNA. All of the pictures of embryos are lateral view with anterior to the left. |

Rescue of hematopoietic defects of nola1 mutant in p53 mutant background. (A) p53+/+ nola1+/?; (B) p53+/+ nola1-/-; (C) p53-/- nola1-/-. Number of HSC (marked by c-myb, red arrows) was partially rescued in nola1 and p53 double mutant at 3 dpf. |

Deficiencies of both dkc1 and nola1 lead to the defects of rRNA processing. (A) Schematic figure modified from previous report [29] shows the overview of rRNA processing. (B) A significant decrease of a precursor strand generating ITS1 and 18 S rRNA was detected in the lanes probed with ITS1 in both dkc1 morphant and nola1 mutant compared with wild type controls (arrows in a and b). The total amount of 18 S rRNA was reduced significantly as shown in the lanes probed with 18 S rRNA probe. The intensity of staining of 18 S rRNA relative to the background was measured using ImageJ program. In contrast, no obvious difference was detected in the lanes probed with ITS2 probe. |