
- Title
-
Fgf Signaling is Required for Photoreceptor Maintenance in the Adult Zebrafish Retina
- Authors
- Hochmann, S., Kaslin, J., Hans, S., Weber, A., Machate, A., Geffarth, M., Funk, R.H., and Brand, M.
- Source
- Full text @ PLoS One
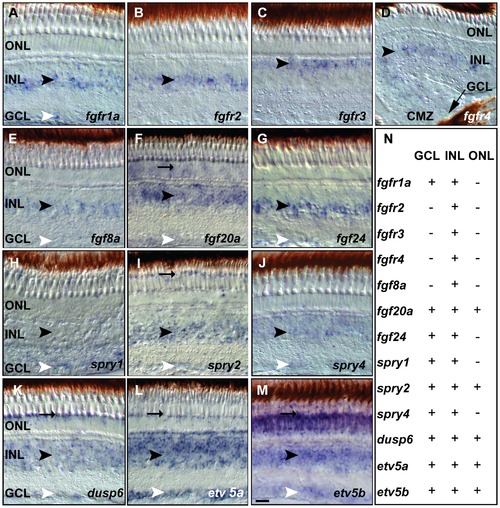
Fgf receptors, ligands and downstream target expression in specific layers of the adult zebrafish retina. A) fgfr1a expression in the INL and GCL. B) fgfr2 signal in the INL C) fgfr3 expression in the outer part of the INL D) fgfr4 expression in the INL next to the CMZ (black arrow). E) fgf8a expression in the INL and weakly in the GCL. F) fgf20a expression in the ONL, INL and GCL. G) fgf24 is detectable in the INL and GCL. H–M) Fgf pathway target gene expression. H) spry1 expression in the INL and GCL. I) spry2 signal in POS, INL and GCL. J) spry4 expression in the INL and weakly in the GCL. K) dusp6 expression is strong in the POS, and in the INL and GCL. L) Strong etv5a expression is found in the POS, INL and GCL. M) etv5b expression is widespread in the ONL, INL and GCL and enriched in the POS. N) Summary of ISH expression data: + expression, - no detectable expression. GCL, ganglion cell layer: white arrowhead; INL, inner nuclear layer: black arrowhead; ONL, outer nuclear layer; POS, photoreceptor layer: black arrow. Scale bar = 20 μm. |
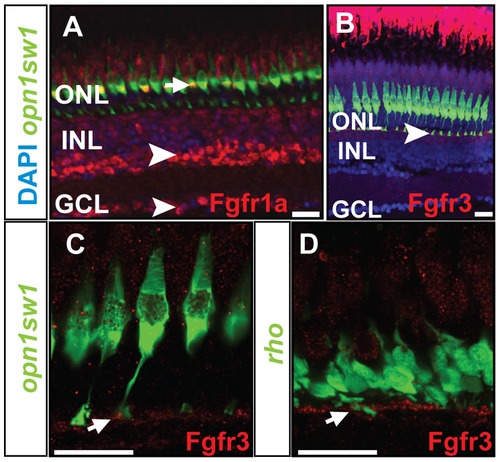
Protein expression pattern of Fgf receptors. A) Fgfr1a protein is detected in the photoreceptor layer colocalizing with UV cones (green) (white arrow), INL and GCL (white arrowhead). B) Expression of Fgfr3 is detected in the outer part of the INL next to the UV cone synaptic terminals (white arrowhead). C, D) Fgfr3 is colocalized with the synaptic terminals of UV cones and rods (white arrows). Scale bars = 20 μm. |
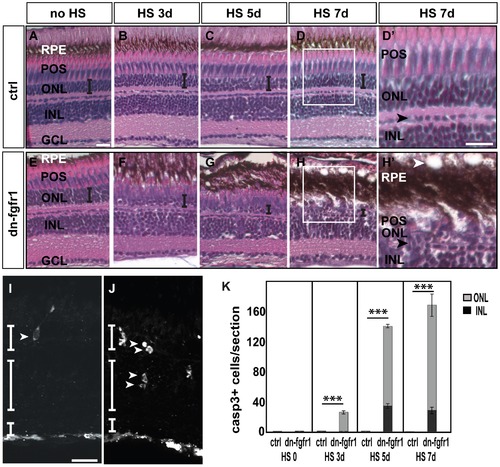
Degeneration of the retina of dn-fgfr1 transgenic animals over time. A, E) Control (ctrl) and Tg(hsp70l:dnfgfr1-EGFP) (dn-fgfr1) siblings without heat shock (HS) treatment: in both cases no morphological changes were detected B–D) In control siblings, the architecture of the retina and the thickness of the ONL (indicated by the error bar) remains unaffected F–H) In contrast, in transgenic animals a decrease in organization and in the width of the ONL (indicated by decreasing size of error bars) is observed. D2, H2) Insets show the normal structure of control retina and the changes in the retinas of dn-fgfr1 animals. In dn-fgfr1 transgenics, vacuoles appear in the RPE (white arrowhead), and the thickness of the RPE increases. The POS and ONL decrease in thickness. For orientation purposes, the black arrowheads indicate the border of horizontal cells. I) An activated Caspase-3 positive cell in the ONL (white arrowhead) after heat shock treatment on three consecutive days. J) Activated Caspase-3 positive cells in the INL and ONL (arrowheads) after five days of Fgf signaling inhibition. G) Quantifications of activated Caspase-3 positive cells per section over time. In wild-type and transgenic fish without any heat shock, dying cells are not detectable (p = 2,28). After three days of heat shock treatment dying cells are detected in the transgenic fish only in the ONL (grey column) (p = 2,44E-08). After five (p = 1,04E-41) and seven days, an increased number of activated Caspase-3 positive cells are in both the ONL (grey column) and INL (black column) (p = 6,42E-26). Shown are the mean numbers of Casp3+ cells/section. Error bars indicate the standard error of the mean (SEM). p-values: *d0.05, **d0.01, ***d0.001. ctrl, control; HS, heat shock; dn-fgfr1, Tg(hsp70l:dnfgfr1-EGFP). Scale bars = 20 μm. |
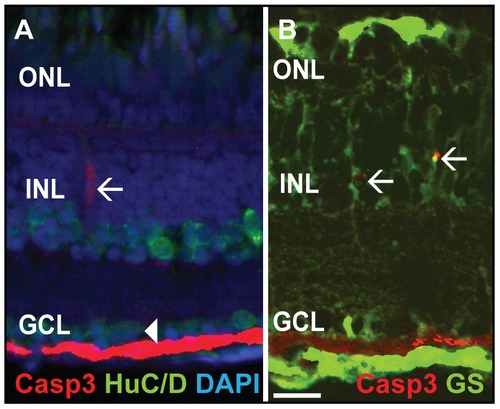
Double labeling of Caspase-3 positive cells. A) Casp3 (red) and HuC/D (green), marker for mature neurons such as amacrine and ganglion cells, do not colocalize in the INL (white arrow) and GCL (white arrowhead). B) Glutamine synthetase (GS, green), a marker for MGC, colocalizes with Casp3+ (red) cells in the INL (white arrows). Scale bar = 20 μm. |
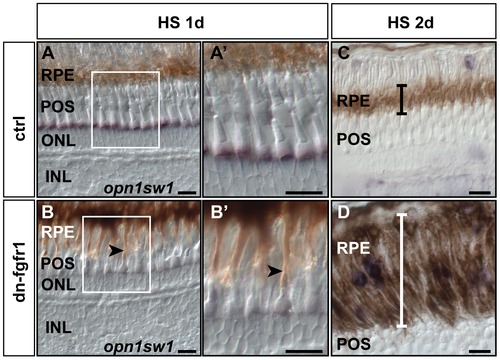
Retinal pigment epithelium is expanded following Fgf signaling inhibition. A) After one day of heat shock treatment control siblings do not show any change in the RPE structure. B) In transgenic siblings, RPE cells appear more stretched, reaching out to the outer segments of the photoreceptor cells (black arrow). A2, B2) At higher magnification, the RPE contacts photoreceptor cells in the POS in the transgenic fish (arrow), while this was not detected in retinas of control fish. C) The black error bar indicates the width of the RPE in control siblings. D) In contrast, the width of the RPE is highly increased (white error bar) in retinas of dn-fgfr1 fish after two days of heat shock treatment. Scale bars = 20 μm. |
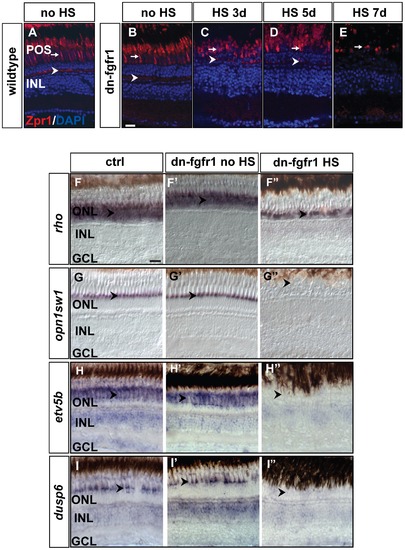
Loss of photoreceptor marker gene expression after Fgf-receptor inhibition. A) Expression of the double cone marker Zpr1 in the outer segments (arrow) and in the photoreceptor synaptic terminals (arrowhead) of control siblings after 7 days of HS. B) Expression or Zpr1 in transgenic fish without HS (arrow and arrowhead), C) after 3 days of HS (arrow and arrowhead), D) after 5 days of HS (arrow and arrowhead), and E) after seven days of HS. Hardly any photoreceptor marker expression remains visible in outer segments (arrow) and the photoreceptor synaptic terminals are no longer detectable. F) The rod photoreceptor marker rhodopsin (rho) is expressed in the ONL (arrowhead) of control siblings. F2) rho expression in the ONL in transgenic non-heatshocked control fish (arrowhead). F3) Reduced rho expression (arrowhead) in dn-fgfr1 transgenic fish after 5 days of HS. G) WT expression of UV opsin (opn1sw1) as a cone photoreceptor marker (arrowhead). G2) Similar expression of UV opsin in the POS of untreated transgenics (arrowhead). G3) Expression of UV opsin is completely absent in transgenic experimental fish (arrowhead) after 2 days of HS. H) WT expression of the Fgf signaling downstream target gene etv5b. Prominent expression is seen in the POS (arrowhead). H2) Comparable expression in untreated dn-fgfr1 fish (arrowhead). H3) Complete lack of etv5b expression after 2 days of heat shock of dn-fgfr1 fish (arrowhead). I) The downstream target dusp6 is expressed broadly in the retina and prominently in the POS (arrowhead). I2) In untreated transgenic fish, a similar pattern as in control siblings was detected with distinct expression in the POS (arrowhead). I3) After 2 days of heat shock induction of the dn-fgfr1 transgene, dusp6 expression is completely lost in the neural retina, including the POS (arrowhead). Scale bars = 20 μm. |
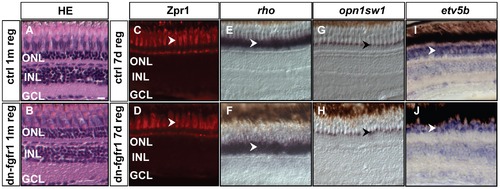
Recovery of retinal tissue architecture and marker gene expression after photoreceptor ablation. A, B) Hematoxylin-eosin staining of control retina after one month. dn-fgfr1 transgenic, regenerated retina has recovered a similar layered structure as the retina of wild-type control siblings. C, D) Expression of the double cone marker Zpr1 is recovered in the photoreceptor cells of dn-fgfr1 fish (arrowheads) after seven days of regeneration and displays a pattern comparable to control retinas. E, F) rho expression recovers in transgenic fish and is highly comparable to control fish (arrowheads). G, H) UV opsin (opn1sw1) expression shows the same pattern in control and in transgenic retinas (arrowheads). I, J) Expression of the downstream target gene etv5b, indicative of Fgf signaling activity, has recovered in dn-fgfr1 fish after seven days of regeneration and expression is indistinguishable from control fish (arrowheads). Scale bar = 20 μm. |
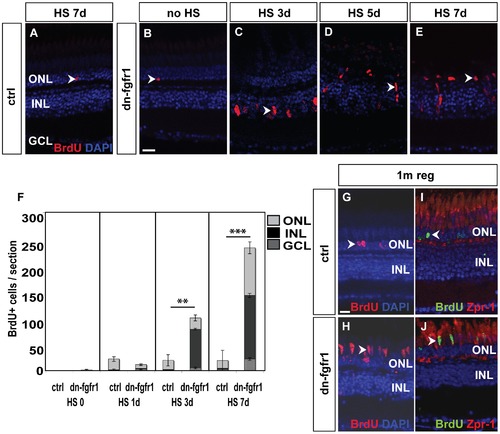
Fgf signaling withdrawal dependent photoreceptor death triggers proliferation response in ONL and INL. A) The control retina shows few BrdU+ cells in the ONL (arrowhead). B) Non-heatshocked control transgenic fish show similar numbers of BrdU+ nuclei in the ONL (arrowhead) as the control. C) After 3 days of heat shock treatment, a strong proliferation response is detectable in the INL (arrowhead). D) After five days, cell clusters and fusiform-shaped cells are found in the INL (arrowhead). E) After seven days of heat shock induction, a large number of BrdU+ nuclei are located in the ONL (arrowhead). F) Quantifications of BrdU+ cells per section. Under control conditions, control siblings and non-treated transgenic fish show hardly any BrdU incorporation. After one day of HS induction, proliferation increases in both groups of experimental fish compared to non-heatshocked controls. There is no significant difference between transgenic and WT siblings (p = 0,11). After three days, many cells proliferate mainly in the INL of transgenic siblings (p = 0,01). At seven days of Fgf signaling inhibition, the number of proliferating cells in the INL and ONL increases even further in dn-fgfr1 fish (p = 4,3E-13). Shown are the mean numbers of BrdU+ nuclei/section. The error bars indicate the SEM. p-values: *d0.05, **d0.01, ***d0.001. G) After 5 d of HS, experimental fish were soaked in BrdU, followed by a one month chase time. In control siblings, BrdU+ nuclei were found after one month of regeneration in the ONL (arrowhead). H) In transgenic fish elongated BrdU+ cell nuclei, which are characteristic for photoreceptor cells, are detected in the photoreceptor layer (arrowhead). I) Zpr1 and BrdU (arrowhead) double positive nuclei were not detectable in control fish. J) In contrast, numerous Zpr1 and BrdU double-labeled cells were found in the photoreceptor layer in retinas of transgenic fish (arrowhead). Scale bars = 20 μm. |
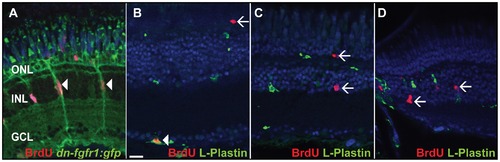
Identification of BrdU+ cells. A) Müller glia cells (green) are proliferating in the INL after seven days of HS (white arrowheads). B) The vast majority of BrdU+ cells in control and transgenic fish in the GCL colocalize with the pan-leukocyte marker L-Plastin (white arrowhead). C) BrdU+ cells in the INL and ONL do not colocalize with L-Plastin in seven days HS control fish (white arrows). D) BrdU+ cells in the INL do not colocalize with L-Plastin in transgenic heat shocked fish (white arrows). Scale bar = 20 μm. |
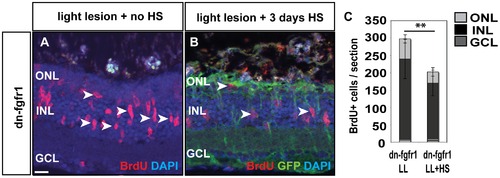
Fgf function in proliferation during regeneration. A) Many cells proliferate in the adult retina 3 days after light lesion (white arrowheads). B) When Fgf signaling is blocked, proliferation is strongly reduced. C) The quantifications show a significant reduction of proliferation after light lesion when Fgf signaling is blocked during the regeneration phase. Scale bar = 20 μm. |
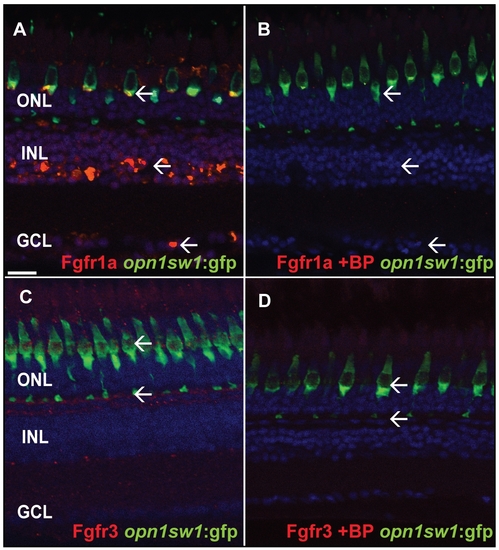
Specificity test for Fgfr antibodies. A) Fgfr1a antibody staining the GCL, INL and photoreceptor layer (white arrows). B) The specific blocking peptide suppresses binding of the Fgfr1a antibody (white arrow). C) Fgfr3 antibody staining in the outer part of the INL adjacent to the photoreceptor synaptic terminals (white arrow). D) The specific blocking peptide inhibits binding of the Fgfr3 antibody (white arrows). Scale bar = 20 μm. |
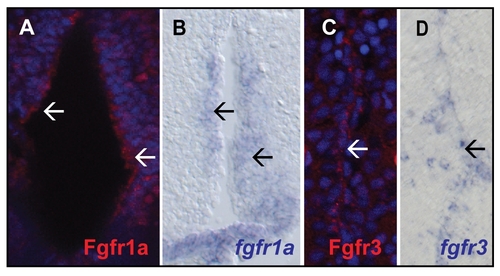
Comparison of Fgfr antibody stainings with in situ hybridizations on telencephalic brain sections of adult zebrafish. A) Fgfr1a staining the ventricle (white arrows) B) In situ hybridization for fgfr1a detectable at the ventricle (black arrows). C) Fgfr3 is expressed in the ventricular zone of the dorsal glia domain (white arrow). D) Similar expression is detected for fgfr3 (black arrow). |
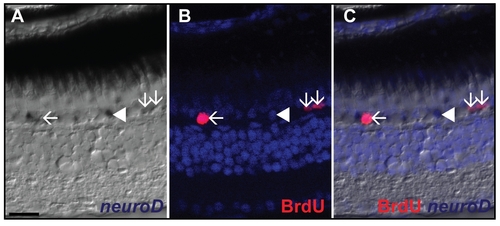
Identification of rod progenitors. A) In situ hybridization of neuroD shows expression in the ONL in one month chase control fish (white arrows). B) BrdU labeling of one month pulse chase fish shows labeling of BrdU in the ONL (white arrows). C) The merged picture shows double labeling of some neuroD+ cells with BrdU (white arrows). neuroD labeled cells which do not colocalize with BrdU are also found in the ONL (white arrowhead). Scale bar = 20 μm. |