
- Title
-
The lineage-specific gene ponzr1 is essential for zebrafish pronephric and pharyngeal arch development
- Authors
- Bedell, V.M., Person, A.D., Larson, J.D., McLoon, A., Balciunas, D., Clark, K.J., Neff, K.I., Nelson, K.E., Bill, B.R., Schimmenti, L.A., Beiraghi, S., and Ekker, S.C.
- Source
- Full text @ Development

ponzr1 expression in the developing zebrafish kidney. (A) lhx1a mRNA expression in the intermediate mesoderm (arrows) at 8S. (B) ponzr1 mRNA expression in the intermediate mesoderm (arrows) at 8S. (C,D) pax2a mRNA expression at 12S (C) is comparable to ponzr1 (D). (E-K) ponzr1 expression is maintained throughout kidney development from intermediate mesoderm to the formation of the pronephric ducts and tubules. Lateral (E) and dorsal (F) views of ponzr1 show expression in the intermediate mesoderm (arrow) at 10S. ponzr1 expression in the pronephric ducts and tubules (arrows) at 13S (G), 15S (H), 18S (I), 21S (J) and 24 hpf (K). (L-O) At 48 hpf (L,M) and 72 hpf (N,O), ponzr1 expression is detected in the pharyngeal arches (open arrows), pronephric tubules (black arrowhead), ducts (black arrow) and glomeruli (open arrowhead). (P,Q) Double in situ hybridizations with pax2a (orange) and ponzr1 (purple) reveal overlapping expression of ponzr1 and pax2a during kidney development (arrows). EXPRESSION / LABELING:
|

ponzr1 expression is regulated by pax2a. (A) Wild-type cdh17 mRNA expression in the pronephric ducts and tubules (arrows) at 24 hpf. (B-F) Injecting 25 pg of pax2a mRNA results in ectopic cdh17 expression anteriorly (B, arrows) and between the pronephric tubules (C, arrows). Endogenous ponzr1 expression is seen in the pronephric ducts and tubules at 24 hpf (D, arrows). Embryos injected with 25 pg of pax2a mRNA reveal ectopic ponzr1 expression between the pronephric tubules (E,F, arrows). (G-J) Dorsal (G,I) and lateral (H,J) views show a loss of ponzr1 expression (I,J) compared with wild-type siblings (G,H) in anterior and posterior pronephros in noitu29a–/–embryos at 32 hpf. |
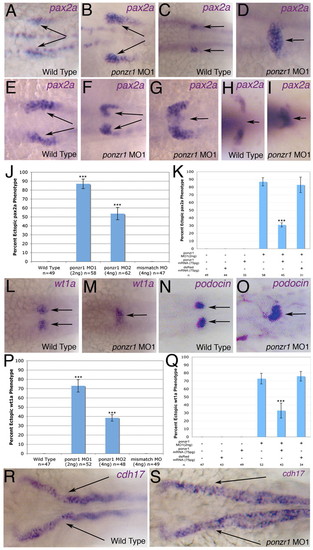
ponzr1 is required for correct kidney patterning by pax2a. (A) pax2a mRNA expression in anterior pronephric tubules (arrows) at 18S. (B) Expanded expression of pax2a at 18S (arrows) in ponzr1 morphants. (C) Wild-type expression of pax2a in the anterior pronephric tubules (arrows) at 24 hpf. (D) ponzr1 morphants show expanded/ectopic pax2a expression toward the midline at 24 hpf (arrow). (E) Wild-type pax2a at 21S (arrows). (F,G) ponzr1 morphants show a pax2a phenotype intermediate 18S and 24 hpf where the invagination (F) of pax2a-expressing cells and the start of the midline fusion (G) can be seen. (H) Wild-type pax2a at 3 dpf. (I) ponzr1 morphants show a maintenance of the ectopic midline expression of pax2a (arrow). (J) Ectopic pax2a phenotype is seen using two independent ponzr1 morpholinos but not in ponzr1 mismatch control. (K) Ectopic pax2a phenotype is rescued using ponzr1 mRNA (P<0.001) but not dsRed mRNA. (L-O) wt1a (L) and podocin (N) mark future podocytes with two distinct expression domains at 24 hpf in controls (arrows). A single midline wt1a (M) and podocin (O) expression domain is seen in ponzr1 morphants at 24 hpf. (P,Q) wt1a phenotype is seen with two ponzr1 morpholinos (P) and can be rescued using ponzr1 mRNA (Q, P<0.001). (R,S) cdh17 expression is detected in the pronephric ducts (R, arrows) and tubules at 48 hpf in controls but is expanded in the pronephric ducts (S, arrows) in ponzr1 morphants at 48 hpf. ***P<0.001 EXPRESSION / LABELING:
PHENOTYPE:
|

ponzr1 is required for anterior kidney form and function. (A) A drawing of a larval zebrafish at 3-4 dpf. The green box is the area of the larva seen in images B-E, and the red box is the area seen in images G-J. (B) Tg(wt1b:EGFP) larvae (Perner et al., 2007) mark podocytes surrounding the glomerulus (arrowhead) and the pronephric tubules (arrows). (C,D) ponzr1 morphants show a loss of fluorescence in the area surrounding the glomerulus, except at the midline (brackets). The pronephric tubular staining is lost (arrows) in a dose-dependent manner (D: 1 ng MO1; E: 1.5 ng MO1). (E) noitb21–/– mutant embryos exhibit a loss of fluorescence around the glomerulus (brackets) and the pronephric tubule fluorescence runs posteriorly instead of laterally (arrows). (F) Two ponzr1 MOs induce a similar phenotype that is ameliorated in mismatch control MO injections. (G) mRFP appears bilaterally in the curvature of the pronephric tubules (arrows) in control embryos due to glomerular filtration. (H-J) In ponzr1 morphants, mRFP is collected in a more posterior part of the tubules – sometimes only one pronephric tubule collects fluorescence and sometimes fluorescence is seen in both (H: 1 ng MO1; I: 1.5 ng MO1). A similar phenotype is seen in noitb21–/– mutant embryos (J). (K) Percentage of embryos with the filtration phenotype. (L-Q) Larvae at 4dpf that have been sectioned and H&E stained. (L) Uninjected embryos show a glomerulus (arrowhead) with two pronephric tubules (arrows). (M) noitb21–/– mutant embryo has a glomerulus (arrowhead) but shows dilated tubules (arrow). (N) ponzr1 morphants show dilated pronephric tubules (arrows) with no glomerulus. (O) The posterior pronephric tubules in wild-type embryos (arrows). noitb21–/– mutant (P) and ponzr1 morphant embryos (Q) both show dilated tubules (arrows). **P<0.01, ***P<0.001 EXPRESSION / LABELING:
PHENOTYPE:
|

Loss of capillary blood flow in ponzr1 morphants. (A,C,E) Tg(wt1b:EGFP) in the podocytes was used to identify the glomerulus in a 3 dpf larvae. (B,D,F) Tg(gata1:dsRed) was used to visualize the blood cells flowing through the glomerular capillaries. (B) Wild-type larvae on the same plane as A show gata1-positive blood cells in the glomerular capillaries (arrows; see supplementary material Movie 1). The bright red line of cells running through the middle of the larvae is the dorsal aorta (arrowhead). (D) Mismatch MO-injected larvae also have blood cells flowing through the glomerular capillaries (arrows; see supplementary material Movie 2) and through the aorta (arrowhead). (F) ponzr1 morphants have no blood cells in the glomerular capillaries, but the cells flowing through the aorta can still be seen (arrowhead; see supplementary material Movie 3). (G) This phenotype is significantly different compared with both wild-type and mismatch MO-injected larvae (*** P<0.001). EXPRESSION / LABELING:
PHENOTYPE:
|

ponzr1 is required for wt1b-expressing pharyngeal arches. (A) A drawing of a 3 dpf larval zebrafish showing where the pharyngeal arches are located. The green box is the area seen in images B and C. (B) Tg(wt1b:EGFP) larvae 3 dpf lateral view shows three pharyngeal arches express wt1b. (C) When ponzr1 MO is injected, the pharyngeal arches are lost. (D) The loss of pharyngeal arches phenotype is significantly different in the two ponzr1 MOs compared with both the wild type and mismatch controls. **P<0.01, ***P<0.001 EXPRESSION / LABELING:
PHENOTYPE:
|

ponzr1 can function as a transcription factor or co-factor. (A) Diagrams showing the transcriptional activator and repressor mRNAs injected into zebrafish. The NLS was included to facilitate nuclear access of the fusion proteins. (B) Dorsal view of wild-type cdh17 expression in the pronephric ducts at 24 hpf. (C) ponzr1 mRNA-injected embryos reveal cdh17 expression loss at the cloaca (arrow). (D) ponzr1-VP16 mRNA-injected embryos show a severely truncated cdh17 expression in the pronephric ducts (arrows). (E) cdh17 phenotype in ponzr1- and ponzr1-VP16-injected embryos are significantly different from control, whereas ponzr1-EnR-injected embryos are not. (F) Wild-type pax2a expression in the anterior pronephric ducts at 24 hpf (magnified I). (G-K) ponzr1-VP16 mRNA-injected embryos (G) show reduced pax2a expression (magnified J) whereas ponzr1-EnR mRNA-injected embryos (H) demonstrate expanded pax2a expression in the anterior pronephric ducts (arrows) (magnified K) at 24 hpf. (L) Quantification of pax2a phenotypes standardized to wild-type pax2a at 100%. Percentage of embryos with reduced pax2a is seen as below 100% (as seen in ponzr1VP16-injected embryos) and expanded pax2a expression is seen above 100% (as seen in ponzr1EnR-injected embryos). Both ponzr1-VP16 and ponzr1-EnR are significantly different from wild type. ***P<0.001 |

Early intermediate mesoderm markers are not altered in ponzr1 morphants. wt1a expression in uninjected controls at 4S (A) and 8S (C) does not differ from wt1a expression in ponzr1 morphants at 4S (B) and 8S (D). lhx1 expression in uninjected controls at 8S (E) and 12S (I) is unaltered in ponzr1 morphants at 8S (F) and 12S (J). pax2a expression in uninjected controls at 8S (G) and 12S (K) is similarly unaltered in ponzr1 morphants at 8S (H) and 12S (L). |

Pronephric tubule and duct marker Tg(atp1a1a.4:GFP) shows no changes in pronephric patterning in ponzr1 morphants. (A-P) Wild-type Tg(atp1a1a.4:GFP) embryos at 28 hpf (A, dorsal; B, lateral) and 48 hpf (I, dorsal; J, lateral) show fluorescence in the pronephric tubules and ducts. Mismatch MO-injected embryos show normal fluorescence patterns at 28 hpf (C, dorsal; D, lateral) and 48 hpf (K, dorsal; L, lateral). Embryos were injected at 1 ng (E,F) and 1.5 ng (G,H) of ponzr1 MO1 show no differences in the amount and localization of the fluorescence at 28 hpf (E,G, dorsal; F,H, lateral) and 48 hpf (M,O, dorsal; N,P, lateral). This experiment was conducted twice viewing at least 35 embryos for each group. |

Pronephric tubule and duct marker Tg(enpep:GFP) shows no changes in pronephric patterning in ponzr1 morphants. (A-P) Wild-yype Tg(enpep.4:GFP) embryos at 28 hpf (A, dorsal; B, lateral) and 48 hpf (I, dorsal; J, lateral) show fluorescence in the pronephric tubules and ducts. Mismatch MO-injected embryos show normal fluorescence patterns at 28 hpf (C, dorsal; D, lateral) and 48 hpf (K, dorsal; L, lateral). Embryos were injected at 1 ng (E,F) and 1.5 ng (G,H) of ponzr1 MO1 show no differences in the amount and localization of the fluorescence at 28 hpf (E,G, dorsal; F,H, lateral) and 48 hpf (M,O, dorsal; N,P, lateral). This experiment was conducted twice with at least 15 embryos in each group. |
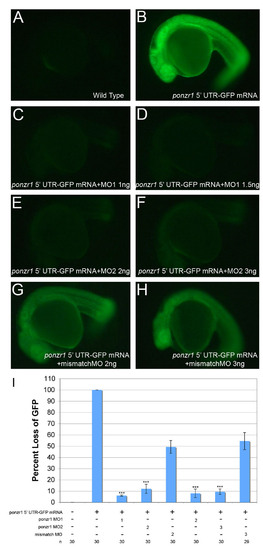
Knockdown efficacy of ponzr1 MOs. (A) Wild-type embryos show a very low level of baseline GFP autofluorescence. This GFP level was defined as 0% and used to standardize between the three independent experiments. (B) Embryos were injected with ponzr1 52 UTR-GFP capped mRNA. This GFP level was defined as 100% for each experiment to standardize between the three experiments. (C,D) ponzr1 MO1-injected embryos show a significant loss of fluorescence as compared to both ponzr1 52 UTR-GFP mRNA and mismatch MO at 1 ng (C) and 2 ng (D) doses. (E,F) ponzr1 MO2-injected embryos also show a significantly decreased fluorescence as compared with ponzr1 52 UTR-GFP mRNA and mismatch MO at both 2 ng (E) and 3 ng (F) doses. (G,H) Mismatch MO-injected embryos show an attenuated knockdown response, demonstrating only a 50% knockdown at both 2 ng (G) and 3 ng (H). (I) Percentage loss of GFP in MO-injected embryos. ponzr1 MO1 and MO2 are significantly different from both mismatch MO and ponzr1 52 UTR-GFP (***P<0.001). |

Loss of posterior four pharyngeal arches in ponzr1 morphants. (A) Wild-type larvae at 5 dpf show cartilage staining in 6 pharyngeal arches with the posterior four highlighted in brackets. (B) ponzr1 MO-injected larvae show a loss of the posterior four pharyngeal arches (brackets). (C) Mismatch MO-injected larvae maintain their arches (brackets). (D) This loss of pharyngeal arch cartilage staining is significantly different in the ponzr1 MO1-injected larvae as compared with both wild type and mismatch MO-injected larvae (***P<0.001). PHENOTYPE:
|