
- Title
-
Novel Tfap2-mediated control of soxE expression facilitated the evolutionary emergence of the neural crest
- Authors
- Van Otterloo, E., Li, W., Garnett, A., Cattell, M., Medeiros, D.M., and Cornell, R.A.
- Source
- Full text @ Development
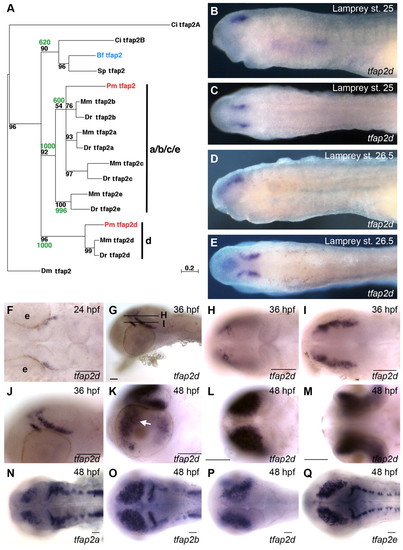
Characterization of embryonic tfap2d expression in zebrafish and lamprey. (A) Phylogenetic tree of deuterostome and Drosophila melanogaster tfap2 genes, constructed using the Maximum Likelihood method (Schmidt et al., 2002). A similar tree topology was obtained using the Neighbor-Joining method (not shown) (Saitou and Nei, 1987). Confidence values for both methods are shown at branch points with quartet-puzzling reliability scores in black and Neighbor-Joining bootstrap values in green. Each gene name includes a prefix with the initials of the corresponding species name. Ci, Ciona intestinalis; Pm, Petromyzon marinus; Mm, Mus musculus; Dr, Danio rerio; Bf, Branchiostoma floridae; Sp, Strongylocentrotus purpuratus; Dm, Drosophila melanogaster. (B-E) Lamprey embryos, fixed at the stage indicated and processed to reveal tfap2d expression. (B,C) Expression of tfap2d is first observed in bilateral spots in the presumed forebrain after neurulation (Tahara st. 25) in lateral (B) and dorsal (C) views. (D,E) Expression in the brain at late larval stage (st. 26.5) in (D) lateral and (E) dorsal views. (F-Q) Wild-type zebrafish embryos, fixed at the stages indicated and processed to reveal expression of tfap2d (F-M) or the indicated tfap2 family member (N-Q) by RNA in situ hybridization. (F) Dorsal view of the head showing tfap2d expression in a distinct structure within the presumptive mesencephalon. (G) Lateral view showing tfap2d expression within two distinct domains of the tegmentum; lines represent field of view for optical sections shown in H and I. (H,I) Dorsal views of the head, expression is in presumed tegmentum. (J) Higher magnification of embryo shown in G. (K) Lateral view of the head of a 48 hpf embryo, showing expression in tegmentum and optic tectum and retina (arrow). (L,M) Dorsal (L) and ventral (M) views of embryo shown in K, focusing on tfap2d expression within the optic tectum and retina, respectively. (N-Q) Embryos at 48 hpf, revealing shared and distinct expression domains of tfap2 family members in the brain. Embryos shown with anterior to the left, unless otherwise indicated. e, eye. Scale bars: 50 μm. |

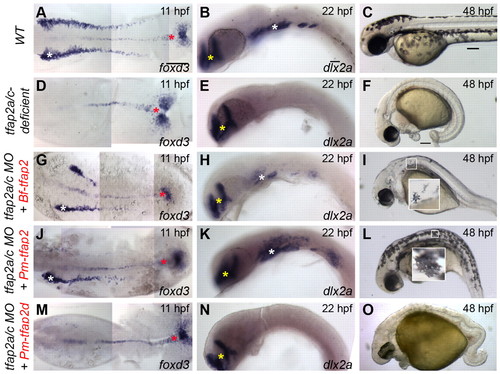
Assessment of the ability of gnathostome Tfap2 paralogs to restore neural crest in tfap2a/c-deficient zebrafish embryos. (A,D,G,J,M,P,S) Dorsal views of flat-mounted wild-type zebrafish embryos (A) or embryos injected with the indicated mRNA and/or MO (D,G,J,M,P,S), fixed at 11 hpf and processed to reveal foxd3 expression. Restored foxd3 expression was found on left, right, or both sides as a result of mosaic injection of mRNA. White asterisks indicate premigratory neural crest. Red asterisks indicate non-neural crest-derived tailbud. (B,E,H,K,N,Q,T) Lateral views of wild-type zebrafish embryos (B) or embryos injected with the indicated mRNA and/or MO (E,H,K,N,Q,T), fixed at 22 hpf and processed to reveal dlx2a expression. With the exception of tfap2d, no trend was seen in the spatial extent of dlx2a expression and the tfap2 paralog used. White asterisks indicate migratory neural crest. Yellow asterisks indicate brain. (C,F,I,L,O,R,U) Lateral views of live embryos at 48 hpf that are wild type (C) or tfap2a mutants injected with tfap2c MO (F,I,L,O,R,U), and injected with the indicated mRNA. Embryos shown with anterior to the left, unless otherwise indicated. Scale bars: in A, 100 μm for A,D,G,J,M,P,S; in B, 50 μm for B,E,H,K,N,Q,T; in C, 100 μm for C,F,I,L,O,R,U. EXPRESSION / LABELING:
PHENOTYPE:
|
Assessment of the ability of lamprey and amphioxus Tfap2 paralogs to restore neural crest in tfap2a/c-deficient zebrafish embryos. (A,D,G,J,M) Dorsal views of flat-mounted wild-type zebrafish embryos (A) or embryos injected with the indicated mRNA and/or MO (D,G,J,M), fixed at 11 hpf and processed to reveal foxd3 expression. White asterisks indicate premigratory neural crest. Red asterisks indicate non-neural crest-derived tailbud. (B,E,H,K,N) Lateral views of wild-type zebrafish embryos (B) or embryos injected with the indicated mRNA and/or MO (E,H,K,N), fixed at 22 hpf and processed to reveal dlx2a expression. White asterisks indicate migratory neural crest. Yellow asterisks indicate brain. (C,F,I,L,O) Lateral views of live embryos at 48 hpf that are wild type (C) or tfap2a mutants injected with tfap2c MO (F,I,L,O), and injected with the indicated mRNA. No trend was seen in the ability of Bf-tfap2 versus Pm-tfap2 to rescue more melanophores per embryos. Insets in figure I and L are higher magnification images of boxed melanophores. Embryos shown with anterior to the left, unless otherwise indicated. Scale bars: in A, 100 μm for A,D,G,J,M; in B, 50 μm for B,E,H,K,N; in C, 100 μm for C,F,I,L,O. EXPRESSION / LABELING:
PHENOTYPE:
|

sox10 is directly regulated by Tfap2a in zebrafish embryos, and forced expression of sox10 can restore melanophores in tfap2a/c-deficient embryos. (A) Schematic of sox10 upstream element sufficient to drive NC-specific expression (Wada et al., 2005). Ex1, exon 1; Ex2, exon 2. Arrows indicate primers used to quantify results of ChIP experiments. (B) Representative quantitative real-time PCR (qPCR) results from anti-Tfap2a antibody ChIP conducted on lysates of 12 hpf zebrafish embryos (mean ± s.e.m. in technical replicates from a single representative experiment). In two additional biological replicates, qPCR revealed <12-fold enrichment at the target site with anti-Tfap2a relative to IgG, and minimal enrichment at the off-target site (data not shown). (C,D) Representative results of qRT-PCR analysis of sox10 (C) or the ednra homolog zgc:85942 (D) mRNA expression in lysates of embryos that were uninjected or injected with MOs targeting tfap2a and tfap2c and with tfap2a-GR mRNA, as indicated, and treated with cycloheximide (CHX) to inhibit protein translation, and with dexamethasone (DEX) to trigger nuclear localization of Tfap2a-GR, as indicated. The results are shown as fold-enrichment relative to levels in uninjected embryos treated with CHX/DEX, after normalization to b-actin. These experiments were performed three times with similar results observed (graphs represent mean ± s.e.m. of one repeat). (E-P) Dorsal (E,F,I,J,M,N) or lateral (G,H,K,L,O,P) views of embryos at the times indicated stage processed with the indicated marker. Embryos are either uninjected or injected with tfap2a and tfap2c MOs (or tfap2c MO injected into tfap2a mutant; K,L,O,P) and hsp70:sox10 plasmid, as indicated. All embryos exposed to heat-shock for 60 minutes at 90% epiboly. Rescue numbers: snai1b, uninjected, 20/23; tfap2a/c-deficient, 0/10; tfap2a/c-deficient plus hsp70:sox10, 19/27; sox9b, uninjected, 24/25; tfap2a/c-deficient, 0/10; tfap2a/c-deficient plus hsp70:sox10, 26/27; crestin, uninjected, 20/20; tfap2a/c-deficient, 0/5; tfap2a/c-deficient plus hsp70:sox10, 0/17; melanophores, uninjected, 59/59; tfap2a/c-deficient, 0/21; tfap2a/c-deficient plus hsp70:sox10,22/30. Embryos shown with anterior to the left, unless otherwise indicated. Scale bars: 100 μm. EXPRESSION / LABELING:
PHENOTYPE:
|
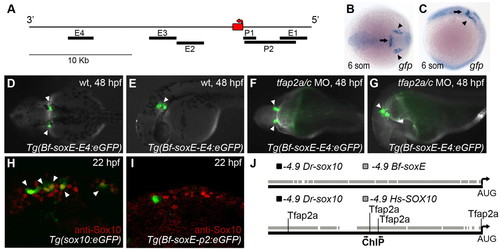
Amphioxus soxE elements fail to drive neural crest specific expression in zebrafish embryos. (A) Schematic of amphioxus soxE locus showing location of DNA elements tested in zebrafish reporter analysis. Red box, coding region of soxE; red arrow, initial AUG. Genomic coordinates are shown in supplementary material Table S2. (B,C) Anterior dorsal (B) and lateral (C) views of a Tg(Bf-soxE-E4:eGFP) zebrafish embryo fixed at 12 hpf and processed for gfp expression. gfp expression in midbrain-hindbrain (arrows) and otic placodes (arrowheads) is apparent. (D-G) Dorsal (D,F) and lateral (E,G) views of live, 48 hpf Tg(Bf-soxE-E4:eGFP) embryos. Arrowheads in D and E indicate GFP expression in otic vesicle (observed in five of 20 injected embryos). (F,G) A Tg(Bf-soxE-E4:eGFP) embryo injected with MOs targeting tfap2a and tfap2c, revealing eGFP expression in otic vesicle (arrowheads) despite an absence of melanophores (otic vesicle expression seen in three of 14 similarly injected transgenic embryos). (H,I) Lateral views of 22 hpf fixed embryos injected with (H) sox10:egfp plasmid (Wada et al., 2005), showing many GFP-positive, anti-Sox10-positive NC cells (arrowheads) in the dorsum (18/22 injected embryos showed dorsal GFP-positive cells), or (I) an analogous plasmid harboring 4.9 kb upstream of amphioxus soxE (Bf-soxE-p2:eGFP), with very few such cells (4/22 embryos showed few dorsal GFP-positive cells all of which were negative for anti-Sox10 immunoreactivity). (J) Modified output of ConSite software showing conservation of sequence and Tfap2 transcription factor binding sites in 4.9 kb of genomic DNA upstream of the start of the initiator AUG in human SOX10 (–4.9 Hs-SOX10) and zebrafish sox10 (–4.9 Dr-sox10). Arrows, region tested in ChIP analysis. An identical comparison of amphioxus soxE (–4.9 Bf-soxE) and zebrafish sox10 using identical parameters fails to detect conserved Tfap2 binding sites. Embryos shown with anterior to the left, unless otherwise indicated. EXPRESSION / LABELING:
|

Expression of zebrafish tfap2 paralogs. (A-E) Lateral views of fixed 24 hpf embryos processed by in situ hybridization to reveal expression of each of the five zebrafish tfap2 paralogs. Anterior is to the left. Scale bar: 50 μm. |
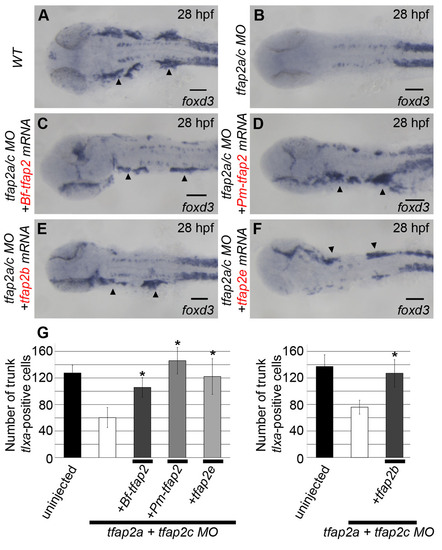
Additional neural crest derivatives rescued by tfap2 homologs. (A-F) All embryos are viewed dorsally and oriented with anterior to the left. (A) Uninjected embryos show clear foxd3 expression at 28 hpf marking the cranial ganglia (arrowheads, 23/23). (B) This expression is absent in embryos injected with MOs targeting tfap2a and tfap2c (0/24). Embryos injected with these MOs and subsequently injected with mRNA encoding (C) amphioxus tfap2 (29/35), (D) lamprey tfap2 (26/26), (E) zebrafish tfap2b (31/33) and (F) tfap2e (22/22) show restored foxd3 expression within the cranial ganglia on either one or both sides (mRNA was injected mosaically). (G) Graph showing cell counts of tlxa-positive cells at 22 hpf, a marker of Rohon-Beard and dorsal root ganglia sensory neuron precursor cells, found in the trunk of embryos injected similarly to those shown in A-F (n=10/group, *P<0.05 relative to tfap2a/tfap2c MO alone group). Of note, the incomplete absence of tlxa-positive cells in tfap2a/tfap2c MO-injected embryos is a previously described Tfap2-independent population (Li and Cornell, 2007). |
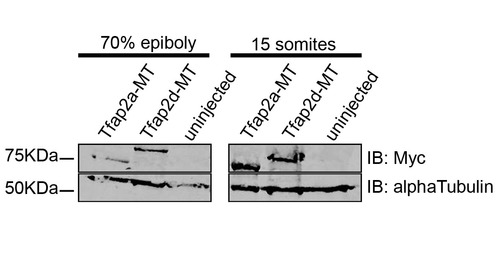
Myc-epitope tagged Tfap2a and Tfap2d show similar stability in zebrafish embryos. Embryos injected with Tfap2a-MT or Tfap2d-MT, or uninjected embryos were harvested at the indicated times, dechorionated and deyolked and subjected to western blot analysis using the indicated antibodies. By <15 somites relatively similar amounts of anti-myc signal are present in both Tfap2a-MT- and Tfap2d-MT-injected embryos with no signal detected in uninjected embryos. Alpha-tubulin is used as a loading control. |

Assessment of ability of Drosophila Tfap2 to restore neural crest in tfap2a/c-deficient zebrafish embryos. (A,D,G) Dorsal views of a flat-mounted (A) wild-type zebrafish embryo or (D) an embryo injected with tfap2a and tfap2c targeting MOs alone or (G) with Drosophila tfap2 mRNA, fixed at 11 hpf and processed to reveal foxd3 expression. White asterisks, premigratory neural crest. Red asterisks, non-neural crest-derived tailbud. (B,E,H) Lateral view of (B) wild-type zebrafish embryo or (E) an embryo injected with tfap2a and tfap2c targeting MOs alone or (H) with Drosophila tfap2 mRNA, fixed at 22 hpf and processed to reveal dlx2a expression. White asterisks, migratory neural crest. Yellow asterisks, brain. (C,F,I) Lateral views of live embryos at 48 hpf that are (C) wild-type or tfap2a mutants (F) injected with tfap2c MO alone or (I) in conjunction with Drosophila tfap2 mRNA. (J) Histograms summarizing neural crest rescue results in tfap2a/c-deficient embryos injected with Drosophila (Dm) tfap2 mRNA. Number of embryos (n) per group is displayed below bar. Scale bars: in A, 100 μm for A,D,G; in B, 50 μm for B,E,H; in C, 100 μm; in F, 100 μm for F,I. |
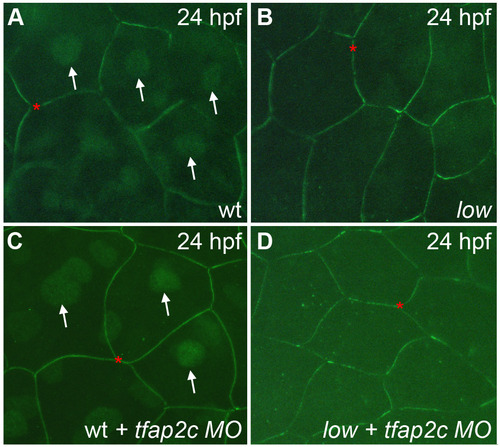
Nuclear anti-Tfap2a immunoreactivity is specific for Tfap2a protein. (A-D) Lateral views of cells of the enveloping layer (EVL), covering the yolk of 24 hpf embryos fixed and processed to reveal anti-Tfap2a immunoreactivity (IR). (A,C) Wild-type and (B,D) presumed tfap2a mutant embryos that are either (A,B) uninjected or (C,D) injected with MO targeting tfap2c. (A,C) In wild-type embryos, anti-Tfap2a IR is visible in nuclei (arrows) and at cell boundaries (red asterisks). (B) Presumed tfap2a mutants lack nuclear staining. Cell boundary staining persists, suggesting that it is non-specific. In (C) wild-type embryos injected with a tfap2c MO, nuclear anti-Tfap2a IR persists, suggesting that anti-Tfap2a is specific to Tfap2a and does not recognize Tfap2c. (D) A presumed tfap2a mutant injected with tfap2c MO. EXPRESSION / LABELING:
|