
- Title
-
Using the Tg(nrd:egfp)/albino Zebrafish Line to Characterize In Vivo Expression of neurod
- Authors
- Thomas, J.L., Ochocinska, M.J., Hitchcock, P.F., and Thummel, R.
- Source
- Full text @ PLoS One

Wholemount brightfield and flourescent images showing nrd:egfp transgene expression in the developing Tg(nrd:egfp)/albino zebrafish. (A) Brightfield image with fluorescent inset showing the absence of transgene expression at 6 hpf. Arrowhead notes the gastrulation site (B) Fluorescent image with a brightfield inset at 24 hpf showing EGFP expression in the developing pancreas (arrow), olfactory bulbs (single arrowhead), and regions of the midbrain and hindbrain (double arrowheads). (C) High magnification overlay of brightfield and fluorescent images at 24 hpf. EGFP is detected in the olfactory bulbs (arrowheads), pineal gland (arrow), and inner ear (top right of panel). At this time it is not observed in the developing eye. (D) High magnification overlay of brightfield and fluorescent images at 24 hpf showing EGFP expression in the neural tube. (E) RNA in situ hybridization at 31 hpf, showing endogenous neurod expression in the ventral nasal patch (arrow), immediately adjacent to the choroid fissure (arrowhead). (F) Fluorescent image showing EGFP-positive cells in the retina at 32 hpf that are within a region (white arrows) immediately adjacent to the ventral nasal patch (black arrow). The choroid fissure is marked with a white arrowhead). (G) High magnification overlay of brightfield and fluorescent images at 48 hpf showing EGFP expression in throughout the inner retina (arrows) and in the outer retina (arrowhead). (H) Overlay of brightfield and fluorescent at 48 hpf (with brightfield image inset), showing EGFP in the developing pancreas. (I–J) Fluorescent (I) and brightfield overlay (J) of image shown in H. EGFP expression is observed in the neural tube and lateral line (arrow). (K) Fluorescent image of the dorsal head at 48 hpf. EGFP expression is observed in the pancreas (arrow), inner ear (arrowhead, with bracket to indicate location of ear), and regions of the CNS. (L) Corresponding overlay of brightfield and fluorescent images. Abbreviations: L (Lens), Re (Retina), AYE (Anal Yolk Extension), Nc (Notochord), Nt (Neural tube). Scale bar: 250 (A); 250 microns (B, H); 100 microns (C, D, I, J); 50 microns (E); 50 microns (K, L). |

Wholemount brightfield and fluorescent images showing nrd:egfp trangene expression in adult Tg(nrd:egfp)/albino zebrafish. (A) A multiple brightfield image overlay showing the entire adult fish. Arrowhead indicates the location of the pineal gland and cerebelum (shown in Panels E and F). The boxes and corresponding panel letter indicate the location of the higher magnification images shown in Panels C–K. (B) Corresponding fluorescent image to Panel A, showing EGFP expression in the eye (white arrow) and the pineal (white arrowhead). (C–D) Brightfield and corresponding fluorescent image showing EGFP expression in the eye. (E) Brightfield image of the dorsal side of the head showing the pineal gland (arrow), telecephalon (Te), and cerebellum (Ce, arrowhead). (F) Corresponding fluorescent image showing EGFP expression in the pineal gland (arrow) and cerebellum (arrowhead). (G–I) Brightfield, overlay, and fluorescent images of the anus and its expression of the transgene. (J–K) Brightfield and corresponding fluorescent image showing EGFP expression in nerves located near the girdle of the tail fin. The box indicates the location of image shown in Panel L. (L) A high magnification fluorescent image of a branch of the nerve shown in Panel K, most likely of the posterior lateral line, showing EGFP expression in each of the terminating synaptic buttons. Scale bar: 2 mm (A). |

Wholemount brightfield and flourescent images showing nrd:egfp transgene expression in the adult caudal tail fin. (A) Brightfield image of the adult caudal fin. (B) Corresponding fluorescent image to panel A. EGFP expression is visualized in the nerve coursing through each bony hemiray of the caudal fin, however at this level of magnification, it is difficult to visualize. (C–C′) High magnification brightfield and corresponding fluorescent overlay showing multiple bony lepidotrichia. The arrows point to the nerve running within each bony hemiray and arrowheads point to EGFP-positive ganglia associated with the nerve. (D and D′) A section of a single bony ray immunolabeled with EGFP to show the transgene and co-labeled with TO-PRO-3 to show all nuclei (magenta). The white line in Panel D shows the location of the nerve. Ep = Epithelium, Bn = bony ray, CT = connective tissue. |

Section from Tg(nrd:egfp)/albino zebrafish showing nrd:egfp trangene expression in the endocrine pancreas (A–A′ ′′) and gut (B–C). (A–A′ ′′). Immunolocalization of EGFP (A, green) co-labels with Insulin (A′, red) in the endocrine pancreas (A′ ′′, En). Co-labeling with TO-PRO-3 shows all nuclei (A′ ′′, blue) and indicates the surrounding exocrine pancreas (A′ ′′, Ex) and adjacent lumen of the gut (A′ ′′, Lu). (B) EGFP expression can be visualized in enteroendocrine cells within each villus and in the surrounding smooth muscle. The adjacent pancreas is also visible (arrow). (C) High magnification image of the box in panel B. |

Retinal sections from embryonic Tg(nrd:egfp)/albino zebrafish immunolabeled with PCNA (red) and EGFP (green). (A) At 42 hpf, EGFP is detected throughout the retinal neuroepithelium in the central retina. PCNA immunolocalization, showing proliferating cells, is primarily restricted to the CMZ (arrows). In the overlapping region of PCNA and EGFP co-labeling can be visualized (arrowhead). (B) At 72 hpf, EGFP is detected in a subset of ganglion, amacrine and bipolar cells, and is not present in the outer nuclear layer. Proliferating cells are restricted to the CMZ (arrows), and there is no evidence of PCNA and EGFP co-immunolabeling. (C) At 96 hpf, there is persistent expression of EGFP detected in a subset of ganglion, amacrine and bipolar cells. Proliferating cells are restricted to the CMZ (arrows) and do not co-label with the transgene. Scale bars: 25 microns (A) and 50 microns (B, C). |
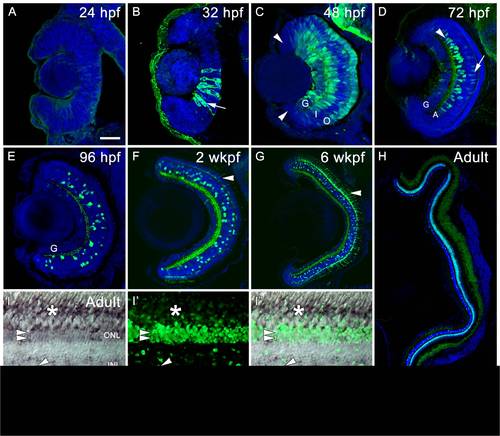
Retinal sections from embryonic Tg(nrd:egfp)/albino zebrafish showing EGFP in green and a nuclear stain, TO-PRO-3, in blue (A–H). All retinas are oriented with dorsal toward the top and ventral toward the bottom. RNA in situ hybridization in adult Tg(nrd:egfp)/albino retinas comparing endogenous expression of neurod to the transgene (I–I′′). (A) At 24 hpf, EGFP is not detected in the retinal neuroepithelium. (B) At 32 hpf, EGFP is detected in a few cells immediately adjacent to the ventral nasal patch (arrow). (C) At 48 hpf, distinct retinal layers can be visualized. EGFP is detected in the ganglion cell layer (G), inner nuclear layer (I) at the level of the amacrine cells, and in the outer nuclear layer (O), but from this timepoint onward, is not detected in the CMZ (arrowheads). (D) At 72 hpf, EGFP expression is restricted to very few ganglion cells (G), a subset of amacrine (A) and bipolar cells (arrow), as well as the inner plexiform layer (arrowhead). (E) At 96 hpf, persistent EGFP expression is visible in a subset of amacrine and bipolar cells, in the inner plexiform layer, and very weakly expressed in a few ganglion cells (G). (F) At 2 wkpf, EGFP begins to reappear in a subset of rod photoreceptors (arrowhead). (G) At 6 wkpf, a majority of rod photoreceptors express EGFP as well as a subset of amacrine and bipolar cells, and the inner plexiform layer. (H) In the adult eye, all rod photoreceptors express EGFP, as well as a subset of amacrine and bipolar cells. (I–I′ ′′) Comparing endogenous neurod (I) to transgenic neurod (I′′) in the adult retina. Endogenous neurod is weakly expressed in rod photoreceptor soma in the outer nuclear layer (ONL, double arrowheads) and their corresponding rod inner segments (asterisk). Expression is also observed in individual neurons in the inner nuclear layer (INL). Strong EGFP was observed in the ONL (double arrowheads) and rod inner segments (above), and in individual neurons in the INL. Every EGFP-positive cell contains at least some endogenous neurod, but the levels vary greatly. Some cells have strong EGFP expression but weak endogenous neurod (single arrowhead), while other show the opposite expression profile (arrow). Scale bars: 50 microns (A–G), 300 microns (H), 50 microns (I–I′ ′′). |
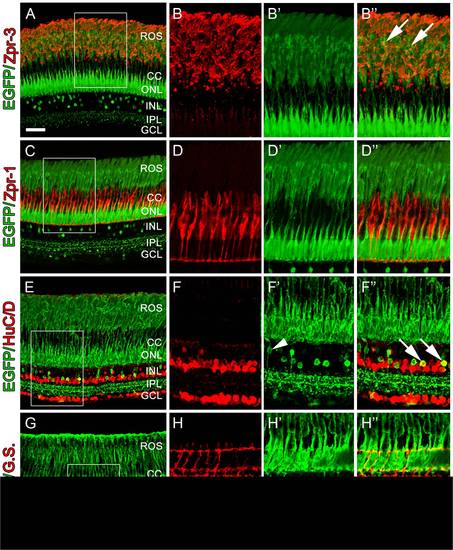
Retinal sections from adult Tg(nrd:egfp)/albino zebrafish. (A) Immunolocalization of GFP (green) to visualize the nrd:egfp transgene and Zpr-3 to visualize rod photoreceptors. (B) Higher magnification inset of (A) showing Zpr-3 immunolocalization in rods. (B′) Overlay image showing that the transgene is present in rod photoreceptors and co-labels with rod inner and out segments. (C) Immunolocalization of GFP (green) to visualize the nrd:egfp transgene and Zpr-1 (red) to visualize double cones. (D) Higher magnification inset of (A) showing Zpr-1 immunolocalization in double cones. (D′) Overlay image showing that EGFP is restricted to rod photoreceptor soma and outer segments and does not co-label with double cones. (E) Immunolocalization of GFP (green) to visualize the nrd:egfp transgene and HuC/D (red) to visualize all amacrine and ganglion cells. (F) Higher magnification inset of (C) showing HuC/D expression in amacrine and ganglion cells only. (F′) Overlay image showing co-labeling of EGFP with a subset of HuC/D-positive amacrine cells (arrows) and a HuC/D-negative bipolar cell extending its processes from the photoreceptors to the IPL (arrowhead). (G) Immunolocalization of GFP (green) to visualize the nrd:egfp transgene and Glutamine Synthetase (G.S.; red) to visualize all Müller glial cells. (H) Higher magnification inset of (E) showing G.S.-positive Müller glial cells. (H′) Overlay image showing that EGFP does not co-label with G.S.-positive Müller glial cells. ROS, rod outer segments; CC, cone cells; ONL, outer nuclear layer; INL, inner nuclear layer; IPL, inner plexiform layer; GCL, ganglion cell layer. Scale bar: 50 microns (A, C, E, G). |

Retinal sections from adult Tg(nrd:egfp)/albino zebrafish over a time course of light treatment and immunolabeled with EGFP (green) to visualize the nrd:egfp transgene and co-labeled with either PCNA (A, C, D, I, J, J′, K, L, L′, M, N) or Glutamine Synthetase (B, G, H). (A) At 48 hours after light onset, almost all rod photoreceptors have been ablated and proliferating cells can be seen in the in the INL. Nuclei are labeled in blue with TO-PRO-3 (TP3). (B) At this time point, Müller glial cells express Glutamine Synthetase (G.S., red, arrow), and do not co-label with EGFP (arrowhead). (C) At 72 hours after light onset, clusters of proliferating progenitors begin to migrate towards the ONL (arrowheads). (D) At 96 hours post light onset, PCNA-positive progenitors (arrowheads) are present in both in INL and ONL, with occasional aberrant migration to the GCL. (E–F) At 72 and 96 hours after light onset, respectively, clusters of progenitors weakly express EGFP (arrowheads). (F) At 96 hours after light onset, EGFP is observed in a newly-formed and disorganized ONL. (G–H) At 72 and 96 hours after light onset, respectively, weakly-EGFP-positive clusters in the INL (arrowheads) down-regulated Glutamine Synthetase. Müller glial cells that did not re-enter the cell cycle strongly express G.S. (arrows), but are EGFP-negative. (I–J′) At 72 hours after light onset, weakly-EGFP-positive cells in both the INL and ONL co-label with PCNA. The box in I represents the PCNA and EGFP labeling shown in J and J2, respectively. (K–L′) At 96 hours after light onset, weakly-EGFP-positive cells in both the INL (arrowheads) and ONL continue to co-label with PCNA. The box in K represents the PCNA and EGFP labeling shown in L and L2, respectively. (M) At 7 days after light onset, a subset of PCNA-positive progenitors in the ONL co-label with EGFP (N) At 11 days after light onset, only a few PCNA-positive progenitors remain in the ONL. EGFP can be visualized in rod photoreceptors and newly-formed rod inner segments (arrowhead). |
High magnification images of retinal sections from adult Tg(nrd:egfp)/albino zebrafish over a time course of light treatment. Sections were immunolabeled with EGFP (green) to visualize the nrd:egfp transgene and Zpr-3 (red) to visualize rod photoreceptors. (A) Prior to light treatment (0 hr), EGFP co-labels with Zpr-3 and is observed in rod photoreceptor soma, rod inner segments (RIS) and rod outer segments (ROS). (B) At 48 hours after light onset, the ROS and RIS are almost completely destroyed and only a few EGFP-positive cells remain in the ONL. (C) At 72 hours after light onset, newly-formed rod progenitor cells are present in the ONL. These could be readily discerned from existing rod photoreceptors due to their comparably weak expression of the transgene (inset shows new rod progenitor on the left). (D) At 96 hours after light onset, a greater number of new regenerated cells are present in the ONL, although it still somewhat disorganized. (E) At 7 days after light onset, newly differentiated rod photoreceptors appear more organized and greater in abundance. (F) At 11 days after light onset, EGFP is expressed in the newly formed rod photoreceptors and co-labels with Zpr-3-positive and newly-formed RIS and R0S. Scale bar: 50 microns (A–F). |

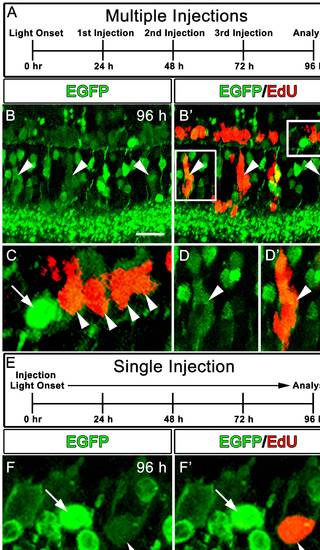
Retinal sections from adult Tg(nrd:egfp)/albino zebrafish at 96 hours after light onset showing transgene expression (green) and EdU labeling (red). (A). Schematic representation of EdU injections during the light time course with corresponding immunolocalization shown in Panels B–D′. (B–B′) EGFP and EGFP/EdU co-labeling, respectively, showing weakly-EGFP-positive cells in the INL (arrowheads) and ONL co-label with EdU. The boxes in B′ represent the panels shown in C–D′. (C) Higher magnification image of the box shown in the top right of Panel B′. Note that the weakly-EGFP-positive progenitors co-label with EdU (arrowheads), but strongly-EGFP-positive rod nuclei (arrow) are EdU-negative. (D–D′) Higher magnification image of the box shown in the left of Panel B′, showing EGFP and EdU immunolocalization, respectively, in a cluster of INL progenitors. (E) Schematic representation of a single EdU injection prior starting the light treatment in order to label a subset of the progenitors. (F–F′). High magnification confocal microscopy showing EGFP and EGFP/EdU co-labeling in the ONL at 96 hours after light onset. An individual EdU-positive cell in the ONL (arrowhead) co-labels with weak EGFP expression. The strongly-EGFP-positive cell, in contrast, is EdU-negative (arrow). |

RNA in situ hybridization on retinal sections from adult Tg(nrd:egfp)/albino zebrafish comparing endogenous neurod expression (purple) to transgene expression (green) during light-induced retinal regeneration. (A) Before light treatment (0 hr), endogenous neurod is expressed in a subset of amacrine and bipolar cells, weakly expressed in rod photoreceptors in the ONL (arrowhead), and expressed in rod inner segments (RIS). (B) The nrd:egfp transgene is expressed in a subset of amacrine and bipolar cells, in rod photoreceptors in the ONL (arrowhead), and weakly in RIS. (C) Overlay of panels (A) and (B). (C2) Higher magnification inset of (C) showing co-labeling of endogenous and transgenic neurod expression in a subset of cells in the INL (arrowheads). (D) 72 hours after light onset (72 hr), all rod photoreceptors have been ablated (indicated by the asterisk), and endogenous neurod is persistently expressed in a subset of amacrine and bipolar cells. (E) The nrd:egfp transgene is persistently expressed in a subset of amacrine and bipolar cells. (F) Overlay of panels (D) and (E). (F′) Higher magnification inset of (F) showing co-labeling of endogenous and transgenic neurod expression in a column of progenitor cells (indicated by the arrowhead), and a subset of cells of the INL. (G) 7 days after light onset (7 d), endogenous neurod is strongly expressed in newly formed rods in the ONL (black arrowhead), and persistently expressed in a subset of amacrine and bipolar cells. The inset shows expression of neurod in newly-formed rod inner segments (white arrowhead). (H) The transgene is more weakly expressed in newly formed rods, and persistently expressed in a subset of amacrine and bipolar cells. (I) Overlay of panels (G) and (H). (I′) Higher magnification inset of (I) showing co-labeling of endogenous and transgenic neurod expression in a subset of INL cells (arrowhead), and in newly formed rod progenitors. Scale bar: 50 microns (A–C, D–F, G–I). |