
- Title
-
Zebrafish prox1b Mutants Develop a Lymphatic Vasculature, and prox1b Does Not Specifically Mark Lymphatic Endothelial Cells
- Authors
- Tao, S., Witte, M., Bryson-Richardson, R.J., Currie, P.D., Hogan, B.M., and Schulte-Merker, S.
- Source
- Full text @ PLoS One
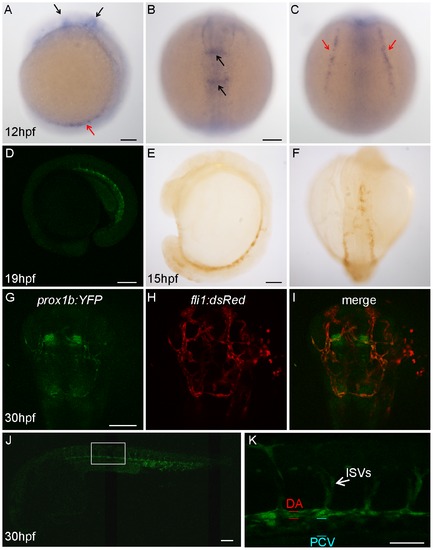
Prox1b is expressed in the endothelial cells and the central nervous system of the head. (A–C) shows prox1b transcript expression by whole mount in situ hybridization in wild-type embryos, at 12 hpf. Black arrows point to prox1b expression in the head; red arrows indicate prox1b expression in lateral plate mesoderm. Confocal image (D) shows YFP expression in a prox1b BAC:YFP embryo at 19 hpf stage. (E) and (F) show YFP expression, enhanced by DAB immunostaining, is detected in prox1b BAC:YFP embryos in migrating angioblasts at 15 hpf. (G–I) shows prox1b:YFP expression in the head region of a prox1b BAC:YFP, fli1:DsRed embryo. Note overlapping (endothelial cells) and non-overlapping expression domains. (J) shows prox1b:YFP expression in the trunk vasculature. (K) shows enlarged view of the boxed area in (J). Scale bars represent 50 μm in (K), and 100 μm in other figures. EXPRESSION / LABELING:
|
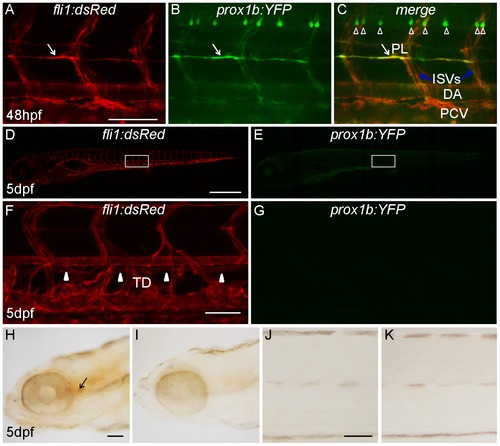
Prox1b does not specifically mark lymphatic aspects of the vasculature. (A–C) shows prox1b:YFP expression in motor neurons and all endothelial cells of a prox1b BAC:YFP, fli1:DsRed embryo at 48 hpf. White arrows point to parachordal lymphangioblasts. The white open arrowheads label motor neurons. Note that while there is expression of prox1:YFP in PLs, prox1b is also expressed in other (non-lymphatic) aspects of the vasculature. (D) and (E) show the fluorescence images of the same 5-day prox1b BAC:YFP, fli1:DsRed embryo. There is no detectable prox1b:YFP expression in the trunk region of the transgenic embryos (E). (F) and (G) show the enlarged views of the boxed area in (D) and (E). (F) White arrowheads indicate the TD, which resides between DA and PCV. (G) prox1b:YFP expression cannot be detected in TD. (H) and (J) show weak DAB immunostaining against YFP expression in the head (H, indicated by the black arrow), but not in the trunk of transgenic embryos (J). (I) and (K) are DAB staining controls without primary antibody. Scale bars represent 250 μm in (D), and 50 μm in other figures. |

Morpholino-mediated knock-down of prox1b does not cause lymphatic phenotypes. (A) and (B) show schematics of the prox1b genomic locus with the red bars indicating target sites of the respective splice morpholinos. The numbered black arrows show the position of the primers used in RT-PCRs for examining the splicing of prox1b transcripts. (A) RT-PCR to detect splicing of prox1b in un-injected (UIC) and splA MO injected embryos. The expression of elongation factor 1-alpha (ef1a) gene represents the loading control. Primer pair F1 and R1 amplifies wild-type transcript band (558 bp) and incorrectly spliced transcripts (925 bp), which fail to excise the intron3-4 (367 bp). Primer pair F1 and R2 amplifies wild-type transcript (247 bp) and non-spliced transcripts (614 bp), which retain intron3-4. (B) RT-PCR to detect splicing of prox1b in un-injected and embryos injected with splB MO. Primer pair F2 and R2 amplifies wild-type transcripts (529 bp), which are missing in splB MO injected embryos. Primer pair F2 and R3 amplifies non-spliced transcripts (729 bp), which preferentially accumulated in morphant embryos. (C) Histograms showing the percentage of fli1:GFP embryos with different lengths of TD (10 s<TD<20 s means the partial TD covers the length of 10 to 20 somites in the trunk). Up to 70% of splA MO injected embryos displayed complete or partial loss of TD, even though splA MO seems not to affect prox1b splicing efficiently. Embryos were scored at 5 dpf. (D) Histograms showing the percentage of fli1:GFP embryos with intact or defective TD, and all the scorable embryos (their overall morphology was all right and they had normal blood circulation and did not develop edema at 5 dpf) developed complete TD after injection with splB MO. (E) and (F) show the full images of 5-day UIC (E) and splB MO injected embryos (F). (G) and (H) show enlarged views of the boxed areas in (E) and (F). The white arrowheads indicate the presence of TD in both control embryos (G) and morphants (H). Scale bars represent 250 μm in (E), and 25 μm in (G). PHENOTYPE:
|

The lymphatic development of homozygous prox1bsa0035 mutants appears normal. (A) Schematic representation of the Prox1b protein, with the position of the prox1bsa0035 allele indicated. The homeodomain region (HD) is shown in red, the Prospero domain (PD) in green. The predicted stop mutation occurs at C236 in prox1bsa0035. (B) and (C) show vascular structures in the trunk region of wild-type (wt, B) and homozygous prox1bsa0035 mutant embryos (C) in fli1:GFP background. The white arrows indicate PLs. (D) and (E) show whole embryo lateral view images of 5-day wt (D) and homozygous prox1bsa0035 mutant embryos (E). (F) and (G) show enlarged views of the boxed areas in (D) and (E). The white arrowheads indicate the presence of TD in both control (F) and homozygous prox1bsa0035 embryos (G). Scale bars represent 50 μm in (B), 250 μm in (D) and 25 μm in (F). |

The lymphatic development of maternal-zygotic prox1bsa0035 mutant is unaltered. (A) and (B) show whole embryo lateral view images of 5-day wt (A) and MZ prox1bsa0035 mutant (B) in a SAGFF27C;UAS:GFP background. Perfused blood vessels were labeled by angiography (in red). (C) and (D) show enlarged views of the boxed areas in (A) and (B). The entire lymphatic network in the trunk of zebrafish, which is composed of the GFP-expressing lymphatic vessels-DLLV, ISLV and TD (marked by white arrowheads), is properly formed in wt (C) and MZ prox1bsa0035 mutant embryos (D). Scale bars represent 250 μm in (A), and 25 μm in (C). |

Prox1b transcript expression in zebrafish. (A–O) shows prox1b expression analyzed by in situ hybridization in whole mount embryos (A, D, E, G, H, J, K, M and N) and transverse sections (B, C, F, I, L, and O), at different stages: 24 hpf (A–C), 32 hpf (D–F), 48 hpf (G–I), 72 hpf (J–L) and 5 dpf (M–O). (E), (H), (K) and (N) individually show the enlarged views of the boxed area in (D), (G), (J) and (M). The blue and red bars in (A) represent the positions of the sections in (B) and (C). prox1b expression is prominent in the caudal vein of embryos at 24 hpf (C) and in both the DA and PCV at 32 hpf stage, shown by (E) and (F). (G–O) However, there is no signal in the blood and lymphatic endothelial cells of older embryos at 48 hpf, 72 hpf and 5 dpf. The black arrows point to the dorsal aorta; the blue arrows point to the posterior cardinal vein or caudal vein; and the red arrows point to thoracic duct. The black and blue arrow heads point to the prox1b expression in the DA and PCV separately. NT: neural tube; NC: notochord. Scale bars represent 200 μm in (A), (D), (G), (J), (M); 50 μm in (E), (H), (K) and (N); and 20 μm in (B), (C), (F), (I), (L) and (O). |

Prox1b expression in cloche mutant. (A–D) shows prox1b expression in cloche mutants and siblings. The red and blue arrows point to prox1b expression in the DA and PCV of a sibling embryo separately (A), while this prox1b expression is absent in cloche mutant (B). The black arrows point to signals in the ventral region of the trunk (C) and along the somite boundaries of homozygous cloche mutants (D). (E) The inset shows an enlarged view of the boxed area in (D). The staining indicated by black arrows in C, D and E is either non-endothelial or non-specific because cloche mutant embryos lack endothelial cells. Given the diffuse nature of the staining, the black arrow indicated signal is probably a non-specific artifact of over-staining. Scale bars represent 100 μm in (A), and 50 μm in (E). EXPRESSION / LABELING:
|
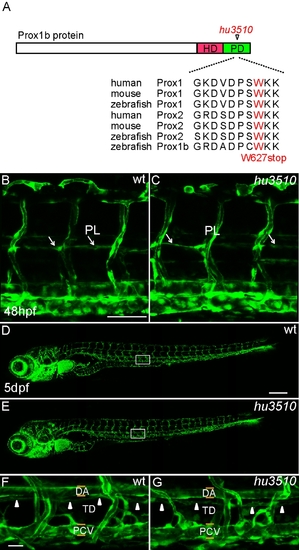
The lymphatic development of homozygous prox1bhu3510 mutant is normal. (A) Schematic representation of the Prox1b protein, with the position of the prox1bhu3510 allele indicated. The homeodomain region is shown in red, the Prospero domain in green. The predicted stop mutation occurs at W627 in prox1bhu3510 and multiple sequence alignment shows the conservation of zebrafish W627 in the Prospero domain of Prox proteins. (B) and (C) show the vascular structures in the trunk region of wt (B) and homozygous prox1bhu3510 mutant embryos (C) in fli1:GFP background. The white arrows indicate PLs. (D) and (E) show the full images of 5-day wt (D) and homozygous prox1bhu3510 mutant embryos (E). (F) and (G) show enlarged views of the boxed areas in (D) and (E). The white arrowheads indicate the presence of TD in both control (F) and homozygous prox1bhu3510 embryos (G). Scale bars represent 50 μm in (B), 250 μm in (D) and 25 μm in (F). |