
- Title
-
Multiple influences of blood flow on cardiomyocyte hypertrophy in the embryonic zebrafish heart
- Authors
- Lin, Y.F., Swinburne, I., and Yelon, D.
- Source
- Full text @ Dev. Biol.
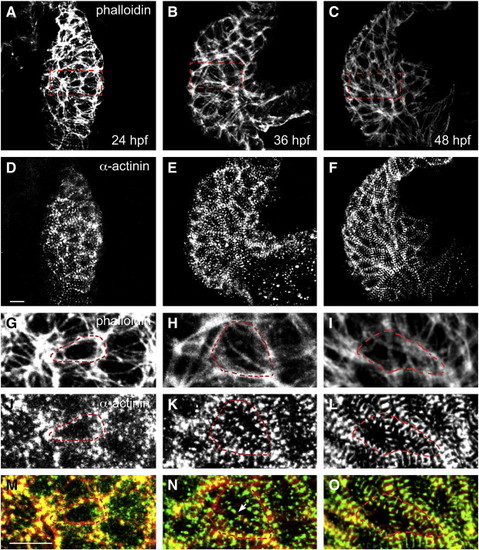
Myofibril maturation proceeds during cardiac chamber emergence. (A–F) Ventral views of dissected wild-type hearts, arterial pole at the top, depict localization of phalloidin (A–C) and α-actinin (D–F) at 24, 36, and 48 hpf. As the ventricular chamber emerges, the striated pattern of myofibril Z-bands becomes increasingly apparent. (G–O) Higher magnification views of the regions marked by red dashed rectangles in A–C indicate the apparent progression of cardiomyocyte surface area expansion (G–I) and increased myofibril organization (J–L). The red dashed polygon outlines an individual cardiomyocyte in each panel. (M–O) Merged view of phalloidin and α-actinin localization reveals the appearance of myofibrils across the cell interior (N, arrow). Scale bars are 10 μm. |
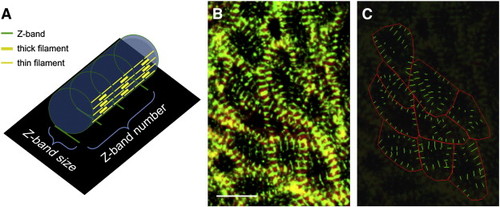
Method for quantification of myofibril content. (A) Schematic depicts a three-dimensional model of a cylindrical myofibril (blue cylinder), with a two-dimensional projection of its Z-bands (black rectangle). Sarcomere organization is illustrated on the side of the cylindrical myofibril. The green rings represent Z-bands, which are equidistant and intersected with thin and thick filaments (yellow lines) perpendicularly. In our confocal images, we view a two-dimensional projection of this type of three-dimensional object, such that Z-bands appear as line segments (green lines on black rectangle). In the two-dimensional projection, the length of a myofibril is represented by the number of parallel Z-bands, and the thickness of a myofibril is represented by the size of each Z-band. (B, C) Localization of cortical actin and Z-bands in the ventricle at 48 hpf, visualized by phalloidin and α-actinin antibody staining (B), can be converted into measurable objects (C). Red polygons, tracing cell boundaries, are used to quantify cell surface area. Green line segments, tracing Z-bands, are used to quantify Z-band size. Scale bar is 10 μm. See Materials and methods and Fig. S1 for additional details regarding our imaging and measurement methods. Method for quantification of myofibril content. (A) Schematic depicts a three-dimensional model of a cylindrical myofibril (blue cylinder), with a two-dimensional projection of its Z-bands (black rectangle). Sarcomere organization is illustrated on the side of the cylindrical myofibril. The green rings represent Z-bands, which are equidistant and intersected with thin and thick filaments (yellow lines) perpendicularly. In our confocal images, we view a two-dimensional projection of this type of three-dimensional object, such that Z-bands appear as line segments (green lines on black rectangle). In the two-dimensional projection, the length of a myofibril is represented by the number of parallel Z-bands, and the thickness of a myofibril is represented by the size of each Z-band. (B, C) Localization of cortical actin and Z-bands in the ventricle at 48 hpf, visualized by phalloidin and α-actinin antibody staining (B), can be converted into measurable objects (C). Red polygons, tracing cell boundaries, are used to quantify cell surface area. Green line segments, tracing Z-bands, are used to quantify Z-band size. Scale bar is 10 μm. See Materials and methods and Fig. S1 for additional details regarding our imaging and measurement methods. |

Live imaging demonstrates hypertrophic behavior of cardiomyocytes. (A, B) Lateral views, arterial pole at the top, of the ventricular outer curvature in a live embryo at 40 hpf (A) and 45 hpf (B); expression of Tg(myl7:mkate-caax) highlights cardiomyocyte cell contours. Selected cells from the central portion of the imaged territory were selected for analysis when they were clearly rendered in the plane of imaging and had adequately intense expression of both transgenes. Numbered cells were compared at 40 and 45 hpf; individual cells could be tracked between timepoints based on the configuration of cell contacts and the landmarks provided by variation in levels of transgene expression. For example, the position of cell 2 is unambiguous because of its relationships to cells 1, 3, and 4, all of which exhibit lower levels of transgene expression. (C, D) Lateral view of the ventricular outer curvature in the same live embryo at 40 hpf (C) and 45 hpf (D); expression of Tg(myl7:actn3b-egfp) highlights Z-bands. (E, F) Overlay of the fluorescent signals from both transgenes reveals changes in cell size and myofibril content between 40 and 45 hpf. The hypertrophic cell outlined in white is cell #3 from panels A and B; its surface area increased 25.6% over the imaged time interval and its Z-bands became larger and more numerous, resulting in a 103.4% change in total Z-band size. See Materials and methods for additional details regarding our imaging and measurement methods. Scale bars are 10 μm. |
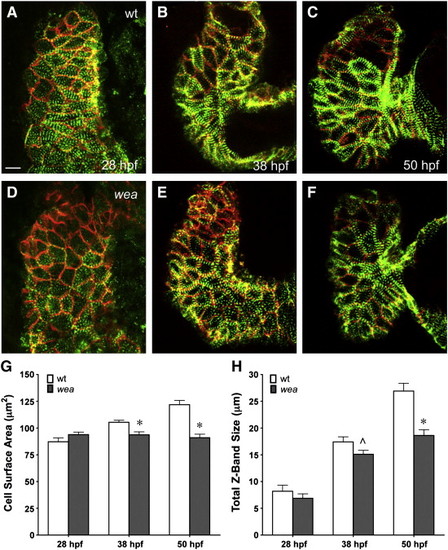
Myofibril maturation is diminished in wea mutant embryos. (A–F) Ventral views, arterial pole at the top, of dissected hearts at 28, 38, and 50 hpf depict localization of Actn3b-egfp (green) in Z-bodies and Z-bands and Dm-grasp (red) at cell boundaries. Actn3b-egfp and Dm-grasp localization indicate the dynamic progression of cell size and myofibril content during chamber emergence. Wild-type (wt) and wea mutant ventricular cardiomyocytes are indistinguishable at 28 hpf (A, D), but cell size expansion and myofibril growth and organization do not progress normally in wea mutants (B, C, E, F). Scale bar is 10 μm. (G) Bar graph indicates mean cell surface area measurements in μm2 for ventricular cardiomyocytes at the indicated stages; error bars indicate standard error. Asterisks indicate statistically significant differences between wild-type and wea (p < 0.05); these differences become apparent by 38 hpf. (H) Bar graph indicates mean measurements of total Z-band size in μm per ventricular cardiomyocyte at the indicated stages; error bars indicate standard error. The asterisk indicates a statistically significant difference between wild-type and wea at 50 hpf (p < 0.05). The carat indicates a less striking difference between wild-type and wea at 38 hpf (p = 0.06). |

Illustration of method for measuring cardiomyocyte cell size and myofibril content. (A) To measure cell surface area and total Z-band size, we begin by visualizing cardiomyocyte boundaries, marked here by phalloidin staining in a ventral view of the ventricle, arterial pole at the top, at 48 hpf. (B) Cortical actin filaments are substantially thicker than the actin filaments in myofibrils that cross the cell. We therefore trace cell contours (red outlines) based on thick cortical phalloidin staining and then measure the area of the resulting polygons, as in our prior work (Auman et al., 2007). (C) Red polygons are overlaid on the corresponding image of anti-α-actinin staining in the same ventricle to provide visualization of myofibril Z-bands within individual cells. (D) We trace line segments (green lines) corresponding to individual Z-bands that appear in a series of at least three parallel bands. Because the ventricular myocardial wall is only one cell thick at the stages examined (Peshkovsky et al., 2011) (Fig. S6), we can assign observed Z-bands reliably to individual cells. (D) We trace line segments (green lines) corresponding to individual Z-bands that appear in a series of at least three parallel bands. Because the ventricular myocardial wall is only one cell thick at the stages examined (Peshkovsky et al., 2011) (Fig. S6), we can assign observed Z-bands reliably to individual cells. (E, F) The process of tracing line segments (blue and yellow lines) continues in each individual cell. When Z-bands cross borders of neighboring cells, the line segments are subdivided and the contribution of each portion is assigned to its respective cell (white arrowhead). Scale bars are 10 μm. |
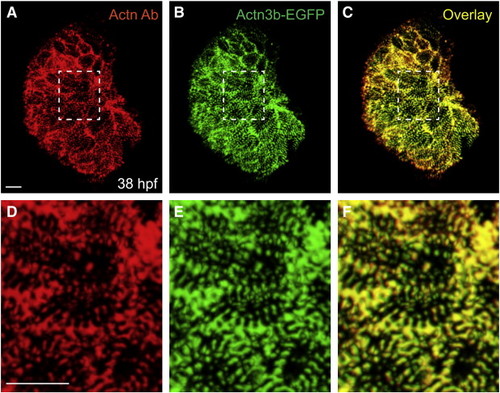
Tg(myl7:actn3b-egfp) faithfully labels myofibril Z-bands and Z-bodies. (A–C) Ventral view, arterial pole at the top, of a ventricle at 38 hpf from an embryo expressing Tg(myl7:actn3b-egfp). (A) Immunofluorescence (red) localizes α-actinin in Z-bands and Z-bodies within ventricular cardiomyocytes. (B) Native green fluorescence indicates incorporation of the Actn3b-egfp fusion protein into Z-bands and Z-bodies. (C) Overlay and comparison of red and green fluorescence indicates strong correspondence between the incorporation of Actn3b-egfp and the localization of α-actinin. Therefore, the Tg(myl7:actn3b-egfp) transgene provides an effective method for labeling myofibril Z-bands and Z-bodies. (D–F) Higher magnification views of the regions marked by white dashed rectangles in panels A–C. Scale bars are 10 μm. |
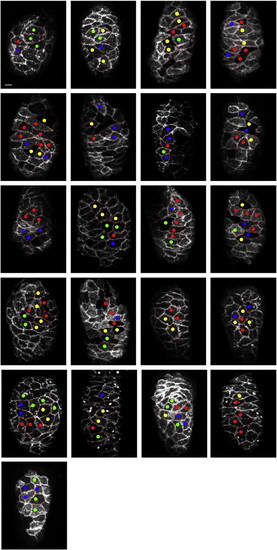
Spatial distribution of behavioral heterogeneity in wild-type hearts. Images display the entire collection of wild-type hearts examined by live imaging. Lateral views, oriented with the arterial pole at the top, depict Tg(myl7:mkate-caax) expression in each ventricle at 40 hpf. Dots indicate all of the examined cardiomyocytes, and each dot′s color corresponds to the observed behavior of that cell, according to the color code established in Fig. 5. Scale bar is 10 μm. |

Spatial distribution of behavioral heterogeneity in wea morphant hearts. Images display the entire collection of wea morphant hearts examined by live imaging. As in Fig. S3, lateral views, oriented with the arterial pole at the top, depict Tg(myl7:mkate-caax) expression in each ventricle at 40 hpf. Dots indicate all of the examined cardiomyocytes, and each dot′s color corresponds to the observed behavior of that cell, according to the color code established in Fig. 5. Scale bar is 10 μm. Images display the entire collection of wea morphant hearts examined by live imaging. As in Fig. S3, lateral views, oriented with the arterial pole at the top, depict Tg(myl7:mkate-caax) expression in each ventricle at 40 hpf. Dots indicate all of the examined cardiomyocytes, and each dot′s color corresponds to the observed behavior of that cell, according to the color code established in Fig. 5. Scale bar is 10 μm. |

The ventricular myocardium is typically one cell thick at 48 hpf. Single confocal sections display the circumference of the ventricular outer curvature of wild-type (A) and wea morphant (B) embryos at 48 hpf. Tg(myl7:ras-gfp) (Chi et al., 2008) labels cardiomyocyte membranes. In wild-type embryos (A), the ventricular myocardium is typically one cell thick at this stage, and there is little variation in wall thickness ([Chi et al., 2008] and [Peshkovsky et al., 2011]), suggesting that cardiomyocyte volume is generally likely to be proportional to cell surface area at this stage. The same is true in wea morphant embryos (B). Occasional cells bulge toward the lumen of the chamber (arrow, A); this cell behavior seems to occur with a similar frequency in both wild-type and wea morphant embryos. Scale bar is 10 μm. |
Reprinted from Developmental Biology, 362(2), Lin, Y.F., Swinburne, I., and Yelon, D., Multiple influences of blood flow on cardiomyocyte hypertrophy in the embryonic zebrafish heart, 242-253, Copyright (2012) with permission from Elsevier. Full text @ Dev. Biol.