
- Title
-
αE-catenin regulates cell-cell adhesion and membrane blebbing during zebrafish epiboly
- Authors
- Schepis, A., Sepich, D., and Nelson, W.J.
- Source
- Full text @ Development
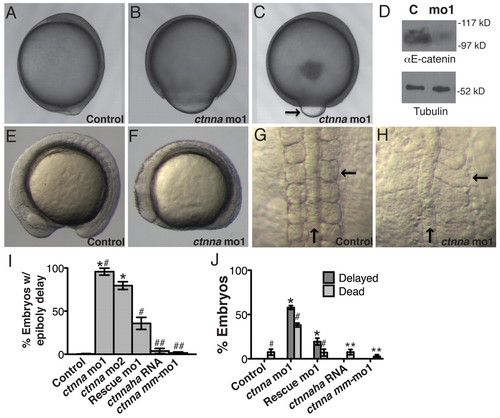
ctnna morphants display morphological defects. (A-C) DIC images of live zebrafish embryos at the end of gastrulation. Arrow indicates yolk bulge. (D) Western blot of αE-catenin and tubulin in whole-embryo extracts at the same stages as those shown in A-C. (E,F) Lateral view images of live embryos at the mid-segmentation stage. (G,H) Images of live embryos, dorsal view. Horizontal arrow indicates somite, vertical arrow indicates notochord. (I) Percentage of embryos exhibiting epiboly delay at the end of gastrulation, as shown in B,C. Three independent experiments with n>70: *P<10–6 versus control, #P<10–5 versus rescue. ##, not significantly different from control by Student’s t-test. (J) Fraction of embryos dead or delayed by mid-segmentation, as shown in E,F. Three independent experiments, n>70 embryos. *P<10–6, # control or rescue vs morphant P<10–5. **, not significant. Error bars indicate s.d. PHENOTYPE:
|

ctnna morphants are delayed in epiboly. (A-C) Immunofluorescence images of fixed zebrafish embryos stained for β-catenin. AP, animal pole; VP, vegetal pole. Upper arrow indicates deep cell margin, lower arrow indicates EVL margin. (D-F) Confocal fluorescence images of Ctnna antibody staining of the most external epiblast layer at the animal pole of embryos at 50% epiboly. Scale bar: 10 μm. (G) Rescue embryos stained for the HA tag; same view as D-F. Scale bar: 10 μm. (H) Percentage of epiboly of the deep cell (DC) and EVL margins. Three independent experiments, n=25 embryos. *P<0.006, #P<0.001. Error bars indicate s.d. EXPRESSION / LABELING:
PHENOTYPE:
|

αE-catenin depletion causes defects in EVL cell morphology. (A-E) Confocal images of cells at EVL margin at 80% epiboly stained for F-actin with rhodamine phalloidin. Scale bar: 10 μm. (F) Quantification of length-width ratio (LWR) of cells at the EVL margin. Three independent experiments, n=40 cells from eight embryos. *P<0.002; #P<0.003. Error bars indicate s.d. PHENOTYPE:
|

αE-catenin and E-cadherin depletion causes defects in radial intercalation (RI). (A-C) Confocal images from time-lapse movies at the most external epiblast layer of the animal pole at 50% epiboly. Membranes are labeled with mbGFP. Positive numbers indicate cells appearing in the focal plane (undergoing RI). Negative numbers indicate cells migrating back into the in lower epiblast layer (undergoing revRI). Scale bars: 8 μm. (D) Quantification of RI rate and revRI. n=9 embryos. #P<0.0005. Asterisk indicates not significant. Error bars indicate s.e.m. PHENOTYPE:
|
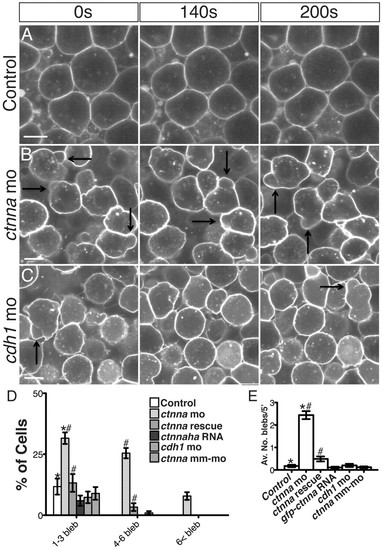
αE-catenin depletion triggers protracted bleb-like protrusions. (A-C) Selected confocal images from time-lapse movies at the most external epiblast layer of the animal pole at 50% epiboly. Membranes are labeled with mbGFP. Arrows indicate membrane blebs. Scale bars: 8 μm. (D) Percentage of cells exhibiting bleb-like protrusions over 5 minutes. n=12 embryos. #P<10–5 control versus rescue, *P<10–5 control versus morphant. Error bars indicate s.e.m. (E) Average number of blebs per cell over 5 minutes. n=12 embryos. #P<10–8 control versus rescue, *P<10–8 control versus morphant. Error bars indicate s.e.m. PHENOTYPE:
|
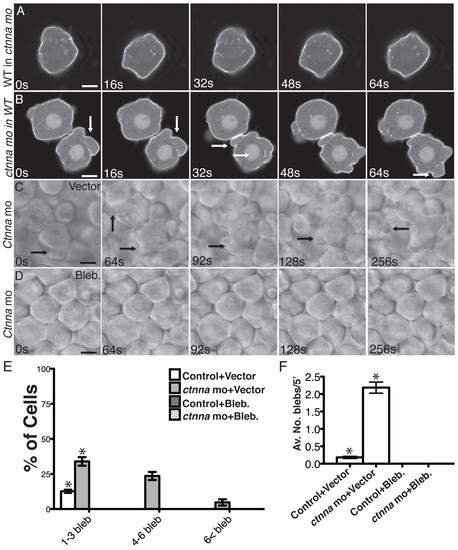
Membrane blebbing triggered by αE-catenin depletion is cell autonomous and myosin II-dependent. (A,B) Selected confocal images from time-lapse movies of transplanted cells expressing mbGFP in the most external epiblast external layer of the host embryos at 50% epiboly. Arrows indicate the blebs. (A) Wild-type (WT) cell in ctnna morphant host embryo. (B) ctnna morphant cell in WT host embryo. Scale bars: 5 μm. (C,D) DIC images from time-lapse movies of untreated (DMSO) embryos or embryos treated with blebbistatin (50 μM) imaged at the most external epiblast layer at the animal pole at 50% epiboly. Scale bars: 8 μm. (E) Percentage of cells exhibiting bleb-like protrusions in untreated embryos or embryos treated with blebbistatin. n=12 embryos. *P<10–8, #P<10–5. Note that no cell exhibited membrane blebbing in embryos treated with blebbistatin. Error bars indicate s.e.m. (F) Average number of blebs per cell untreated embryos or embryos treated with blebbistatin. n=12 embryos. *P<10–9. Note that no cell exhibited membrane blebbing in embryos treated with blebbistatin. Error bars indicate s.e.m. PHENOTYPE:
|
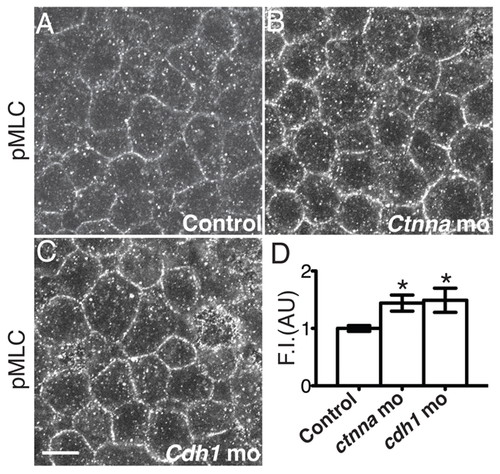
cdh1 and ctnna morphant DCs displayed increased phospho-MLC at cell contacts. (A-C) Confocal images of the epiblast most external layer at the animal pole of embryos at 50% epiboly stained for phospho-MLC. Scale bar: 10 μm. (D) Fluorescence intensity (FI) at cell contacts of embryos stained for pMLC. Three independent experiments, n=300 cell contacts (15 embryos) per experiment. *P<10–3 versus the control (normalized to 1). Error bars indicate s.d. |

Blebbing triggered by αE-catenin depletion is E-cadherin dependent. (A) Selected confocal images from time-lapse movies of transplanted ctnna morphant cells expressing mbGFP in the most external epiblast external layer of the host cdh1 morphant embryos at 50% epiboly. Scale bar: 5 μm. (B) Confocal images from time-lapse movies at the most external epiblast layer of the animal pole of live embryos at 50% epiboly. Membranes are labeled with mbGFP. Arrows indicate membrane blebs. Embryos were co-injected with cdh1 and ctnna mo. Scale bar: 8 μm. (C) Percentage of cells exhibiting bleb-like protrusions. n=12 embryos. *P<10–5. Error bars indicate s.e.m. (D) Average number of blebs per cell. n=12 embryos. *P<10–8. Error bars indicate s.e.m. PHENOTYPE:
|
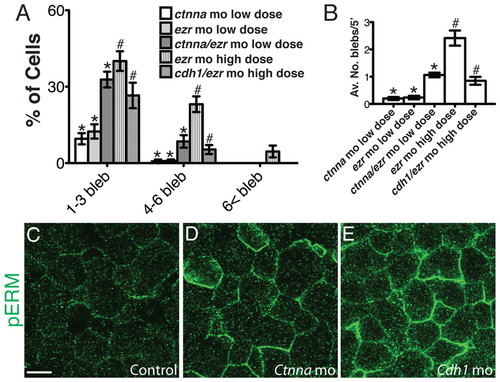
αE-catenin and E-cadherin depletion influence ERM protein localization and membrane blebbing in ezr morphants. (A) Percentage of cells with bleb-like membrane protrusions. n=12 embryos. *P<10–6 ezr or ctnna mo low dose versus ctnna/ezr mo low dose, #P<10–6 ezr mo high dose versus cdh1/ezr mo high dose. (B) Average number of blebs per cell. n=12 embryos. *P<10–6 ezr or ctnna mo low dose versus ctnna/ezr mo low dose, #P<10–5 ezr mo high dose versus cdh1/ezr mo high dose. Error bars indicate s.e.m. (C-E) Confocal images of the most external epiblast layer at the animal pole of embryos at 50% epiboly stained for phospho-ERM proteins. (C) Uninjected control. (D) ctnna morphant. (E) cdh1 morphant. Scale bar: <10 μm. PHENOTYPE:
|

αE-catenin is expressed in deep cells and EVL in early embryogenesis. (A,B) Confocal images of deep cells and EVL cells of embryo at mid-blastula stage stained with an αE-catenin specific antibody. (C,D) Confocal images of deep cells and EVL cells in embryo at 80% epiboly stained with an αE-catenin specific antibody. Scale bar: <10 μm. (E,F) ISH for Pax2.1 and no tail for embryos fixed at 85% epiboly stage. Development of ectoderm (Pax2.1) is delayed in ctnna morphant embryos whereas widened no tail expression is consistent with epiboly delay. PHENOTYPE:
|

ISH for krt4 for embryos fixed at the dome stage. keratin-4 expression is normal in ctnna, cdh1 and ctnna/cdh1 morphant embryos. |
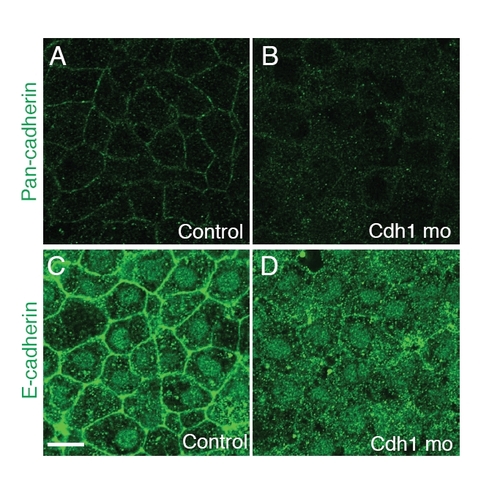
Cdh1 morphants have decreased staining with E-cadherin specific or pan-cadherin antibodies. Confocal images of the most external layer of deep cells at the animal pole of fixed embryos at 50% epiboly stained with a pan-cadherin antibody (A,B) and a zebrafish E-cadherin specific antibody (C,D). Control, uninjected WT; cdh1 mo, embryos injected with cdh1 morpholino. Scale bar: <10 μm. |

Cdh1 and ctnna morphant cells fails to aggregate ex vivo. Embryos were disaggregated using trypsin/EDTA and cells were plated overnight. (A,B) Cells from uninjected control WT embryos treated or not with EGTA. (C) Cells from cdh1 morphant embryos. (D) Cells from ctnna morphant embryos. Scale bar: 200 mm. |

Depletion of ezrin does not cause a defect in immunostaining for E-cadherin or αE-catenin. (A-D) Confocal images of the most external layer of deep cells at the animal pole of fixed embryos at 50% epiboly stained with an E-cadherin antibody (A,B) or an αE-catenin specific antibody (C,D). ezr mo, ezr morphant. Scale bar: <10 μm. |