
- Title
-
Differential regulation of epiboly initiation and progression by zebrafish Eomesodermin A
- Authors
- Du, S., Draper, B.W., Mione, M., Moens, C.B., and Bruce, A.E.
- Source
- Full text @ Dev. Biol.
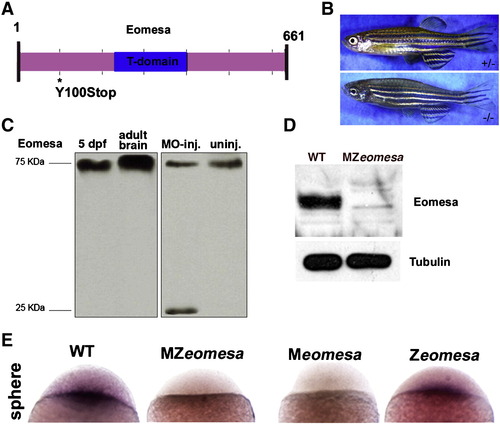
eomesafh105 mutant allele. Schematic of the 661 amino acid full-length Eomesa protein with T-domain in blue. Location of the stop codon in allele fh105 marked by asterisk. (B) Images of heterozygous (top) and homozygous (bottom) eomesafh105 adult fish. (C) Control western blot for the anti-Eomesa antibody, lanes as indicated. (D)Western blot of sphere stage wild type and MZeomesa embryos, lanes as indicated. 15 embryo equivalents loaded per lane. (E) Whole-mount in situ hybridization for eomesa on sphere stage embryos of the indicated genotypes. |
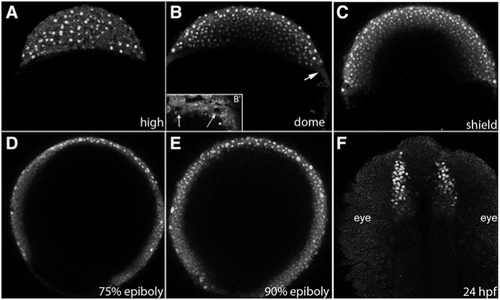
Eomesa protein distribution. Confocal projections of embryos stained with anti-Eomesa antibody. (A-E) lateral views (F) dorsal view. Stages indicated in lower right. Arrow in (B) indicates the YSL. (B′) Inset shows YSL of embryo at sphere stage. Arrows indicate unstained YSL-nuclei that are surrounding by Eomesa positive YSL cytoplasm. |
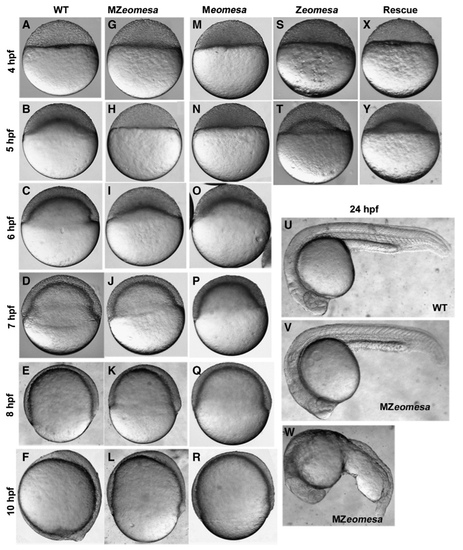
Phenotypes of MZeomesa, Meomesa and Zeomesa mutant embryos. Lateral views of live embryos, stages and genotypes as indicated. Doming is delayed in MZeomesa (H) and Meomesa (N) but not Zeomesa embryos (T). (X, Y) Injection of eomesa-VP16 rescues the timing of epiboly initiation. |
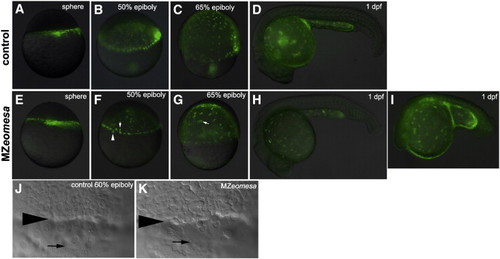
Epiboly progression is normal in MZeomesa embryos. (A-I) Overlays of fluorescent and brighfield images of control (A-D) and MZeomesa (E-I) embryos injected into the YSL with fluorescent histone to highlight the YSN. Stages as indicated. (F) Arrowhead and arrow indicate abnormally large and small nuclei, respectively. (G) Arrow indicates cluster of clumped nuclei not visible in the control embryo in (C). Wild type (H) and abnormal looking (I) MZeomesa embryos at 1 dpf have intact YSLs (J,K) DIC images of the margin of 60% epiboly control (J) and MZeomesa (K) embryo. Arrowhead indicates deep cell margin, arrow indicates EVL margin. PHENOTYPE:
|

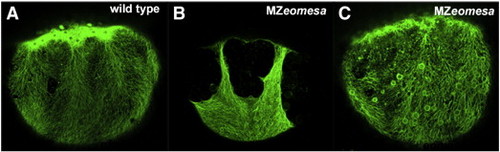
Yolk cell microtubules are altered in MZeomesa embryos. Confocal projections of lateral views of wild type (A-D) and MZeomesa (A′-D′) embryos stained for Tubulin. (A, A′) High stage, (B, B′) sphere stage (C, C′) dome stage, (D, D′) 75% epiboly. (A, A′) Arrows indicate longitudinal microtubule arrays. Arrowheads indicate spherical structures in MZeomesa embryo. (D, D′) arrows indicate blastoderm-yolk cell boundary. EXPRESSION / LABELING:
PHENOTYPE:
|

The actin cytoskeleton is normal is MZeomesa embryos. Confocal projections of lateral views of phalloidin stained embryos. (A-C) wild type and (A′-C′) MZeomesa embryos. (A, A′) sphere stage (B, B′) dome stage, (C, C′) close up of marginal region at 75% epiboly, arrowheads indicate actin band in the YSL. PHENOTYPE:
|
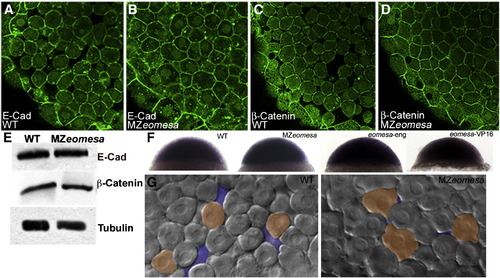
Cell morphology is altered in MZeomesa embryos. (A-D) Confocal images of embryos at sphere stage stained for Cdh1 (A,B) and β-Catenin (C,D). (E) Western blot of wild type (lane 1) and MZeomesa mutant embryo (lane 2) sphere stage extracts. Levels of Cdh1 and β-Catenin are not obviously altered in mutant embryos. (F) Normal cdh1 expression in sphere stage wild type, MZeomesa, eomesa-eng and eomesa-VP16 injected wild type embryos, as indicated. (G) Live DIC images of wild type and MZeomesa embryos at sphere stage. Mutant cells are more tightly packed and exhibit more blebs then wild type cells. Orange highlights selected cell morphologies, purple highlights intercellular space. |

Expression of endoderm markers is reduced in MZeomesa embryos. (A-C′, G, G′, I-J′) lateral views, (D-F′, H, H′, K-M′) animal pole views of embryos stained by whole mount in situ hybridzation. (A-B′) mxtx2 expression at sphere (A-A′′) and dome stage. (B′) gsc in red marks dorsal. (C-D′′) ndr1 expression at sphere (arrow, C,C′) and 40% epiboly (D-D′′). (E, E′) ndr2 expression at 40% epiboly. (F,F′) lft1 expression at 40% epiboly (G-H′) sox32 expression at 40% epiboly, (H′) gsc in red marks dorsal. sox32 expression (I,I′) and sox17 expression (J,J′) at 75% epiboly. Arrowheads indicate dorsal forerunner cells. (K-K′′) gata5 expression at 40% epiboly. (L,L′) bon expression at 40% epiboly (M,M′) og9x expression at 40% epiboly. (N.N′) pou5f1 at oblong/sphere. Genotypes indicated in lower left, probe in upper right and percentages of embryos that exhibited given phenotype shown in lower right where appropriate. EXPRESSION / LABELING:
PHENOTYPE:
|
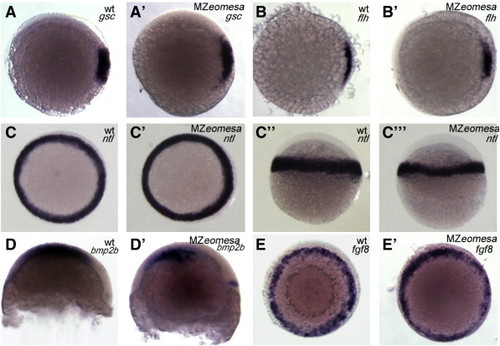
Expression of mesodermal markers is normal in MZeomesa embryos. (A-C′, E, E′) animal pole views (C-C′′, D, D′) lateral views. Genotypes and markers as indicated in upper right. EXPRESSION / LABELING:
|
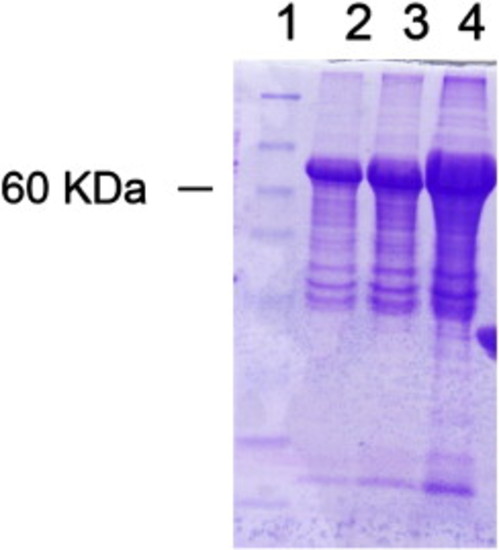
Eomesa inclusion bodies isolation. Comassie staining of acrylamide gel loaded with 1, 2, and 4 µl of Eomesa recombinant protein (concentration 10 mg/ml) in lanes 2, 3 and 4. |

Eomesa in MZeomesa and Zeomesa embryos. Overlay of fluorescence and bright field images of (A) wild type and (B) MZeomesa embryos stained for Eomesa at sphere stage. No nuclear or cytoplasmic fluorescence is detected in MZeomesa embryo. (B-E) Bright field, fluorescene and overlay of embryos stained for Eomesa. Stages indicated on left, genotype in upper right. (B,C) Nuclear staining visible in wild type deep cells but not Zeomesa deep cells at 60% epiboly. Background fluorescence is visible in mutant embryo. (D) Eomesa detected in the brain of wild type (arrowhead) but not Zeomesa (E) embryos at 1 dpf. |
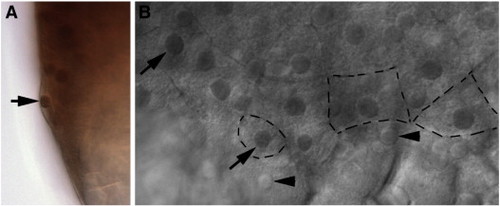
Eomesa expression in the EVL. Antibody staining for Eomesa (A) Lateral view of embryo showing Eomesa in EVL nuclei, arrow. (B) Marginal view of embryo with Eomesa expression in EVL (arrows) but not YSL nuclei (arrowheads). Black dashed lines outline selected EVL cell boundaries. |

Nuclear morphology is normal in MZeomesa embryos. Lateral views of bright field (A,B) and fluorescent (A′,B′) images of fractured DAPI stained wild type (A,A′) and MZeomesa (B,B′) embryos. Nuclear morphology is normal in MZeomesa embryo. |
eomesa-VP16 RNA injection rescues microtubule morphology in MZeomesa embryos. (A-C) Lateral views of confocal projections of Tubulin staining in dome stage embryos. Genotype indicated in top right and injected construct in lower right. (C) Microtubule voids are rescued in eomesa-VP16 injected MZeomesa embryo. |
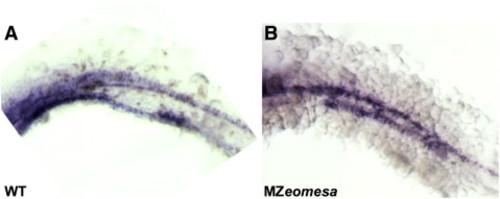
MZeomesa embryos contain endoderm at 24 hpf. Lateral views of deyolked wild type (A) and MZeomesa (B) embryo stained by in situ hybridization for foxA2. EXPRESSION / LABELING:
|
Reprinted from Developmental Biology, 362(1), Du, S., Draper, B.W., Mione, M., Moens, C.B., and Bruce, A.E., Differential regulation of epiboly initiation and progression by zebrafish Eomesodermin A, 11-23, Copyright (2012) with permission from Elsevier. Full text @ Dev. Biol.