
- Title
-
Gβγ signaling controls the polarization of zebrafish primordial germ cells by regulating Rac activity
- Authors
- Xu, H., Kardash, E., Chen, S., Raz, E., and Lin, F.
- Source
- Full text @ Development
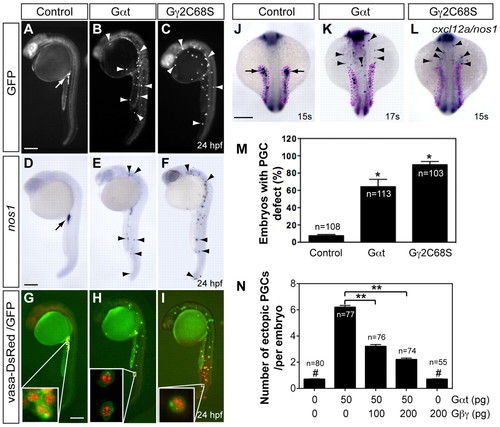
Gβγ signaling is required for the migration, but not differentiation, of PGCs. Embryos injected with RNAs encoding GFP-nos1-3′UTR, either alone (control, 100 pg) or together with Gαt-nos1-3′UTR (50 pg) or Gβ2C68S-nos1-3′UTR (40 pg). Normally localized (arrow) and ectopic (arrowheads) PGCs are indicated. (A-I) Lateral views of embryos showing PGCs labeled with GFP (A-C), expressing nos1 detected by in situ hybridization (D-F) or labeled with vasa-DsRed and GFP (insets show high-magnification images) (G-I). (J-L) The expression of cxcl12a (outlined with magenta dots) and nos1 by in situ hybridization. Dorsal views. Scale bars: 200 μm. (M) The percentage of embryos with PGC migration defects, with the latter defined as more than three PGCs (detected by nos1 expression) per embryo present outside the presumptive gonad region at 24 hpf (Dumstrei et al., 2004). *P<0.01 versus control. (N) Total number of ectopic PGCs per embryo. **P<0.01; #P>0.5 versus control. Data are mean+s.e.m. EXPRESSION / LABELING:
PHENOTYPE:
|
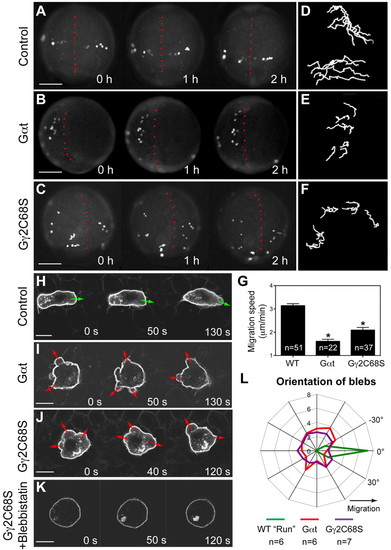
Gβγ signaling regulates the motility and polarity of PGC migration. (A-G) Epifluorescence time-lapse experiments performed on Tol-kop-EGFP-F-nos1-3′UTR embryos, with PGCs expressing membrane-bound GFP (memGFP) at low magnification (5× objective) at 8-10 hpf (supplementary material Movie 1). (A-C) Snapshots from time-lapse movies. Dorsal view; red dotted line indicates the notochord. (D-F) Representative tracks delineate PGC migration routes. (G) Average migration speed of PGCs. *P<0.01 versus control. Data are mean+s.e.m. (H-L) Confocal time-lapse imaging of PGCs expressing memGFP, taken at 8-10 hpf (supplementary material Movie 2). (H-K) Snapshots from movies of the control PGCs during the run phase (H) (green arrows indicate protrusion at the leading edge); Gαt- or Gγ2C68S-expressing PGCs (I,J) (red arrows indicate bleb-like protrusions); PGCs expressing Gγ2C68S in embryos treated with blebbistatin (K). Scale bars: 200 μm in A-C; 10 μm in H-K. (L) Orientation of blebs relative to the direction of PGC migration, as analyzed from four independent movies per group (10-second intervals, blebs grouped into 15° sectors). EXPRESSION / LABELING:
PHENOTYPE:
|

Gβγ signaling regulates actin cytoskeleton dynamics through RhoGTPase Rac. (A-D) Snapshots from epifluorescence time-lapse movies taken of embryos at 8-10 hpf, with actin cytoskeleton dynamics revealed using Lifeact-GFP labeling, in wild-type PGCs and PGCs expressing Gαt or Gγ2C68S (supplementary material Movie 3). White arrows indicate actin brushes; arrowheads indicate blebs. Numbers follow the same bleb. Actin labeling is not obvious in newly formed blebs (yellow arrowheads), but becomes prominent when blebs begin to shrink (red arrowheads). (E-I) Rac activity of PGCs expressing a cytosolic RacFRET biosensor, as determined by time-lapse analysis at 8-9 hpf. (E-H) Pseudocolored images of PGCs showing the ratio of emission from yellow fluorescent protein (YFP) to emission from cyan fluorescent protein (CFP). Wild-type PGCs during the run or tumbling phase (E,F; supplementary material Movie 4); PGCs expressing Gγ2C68S or wild-type Gβ1γ2 (G,H; supplementary material Movie 5). Scale bars: 10 μm. (I) Average Rac activity (mean YFP/CFP emission ratio for the whole cell) in control PGCs and in PGCs expressing Gγ2C68S, dnRac or Gβ1γ2. Total number of PGCs analyzed is indicated. *P<0.01 versus control. Data are mean+s.e.m. PHENOTYPE:
|
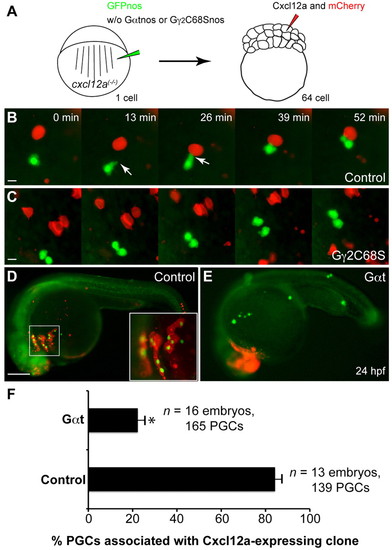
Gγ2C68S- and Gαt-expressing PGCs fail to respond to Cxcl12a. (A) Schematic illustration outlining the chemoattractant assay. cxcl12a(-/-) embryos at the one-cell stage were injected with gfp-nos mRNA (to label PGCs) alone (control) or together with mRNAs encoding either Gγ2C68S-nos1-3′UTR or Gαt-nos1-3′UTR. At the 64-cell stage, a single cell at the animal pole was co-injected with RNAs encoding Cxcl12a and mCherry (tracer). (B,C) Snapshots from time-lapse movies showing the positions of PGCs (green) and Cxcl12a-expressing cells (red) in control embryos (B, supplementary material Movie 6) or in embryos injected with Gγ2C68S-nos1-3′UTR RNA (C, supplementary material Movie 6) at 8-9 hpf. White arrows indicate protrusions. (D,E) Representative embryos at 24 hpf showing localization of control or Gαt-expressing PGCs (green) and the Cxcl12a-expressing cells (red). Inset indicates high-magnification image of the boxed area. Scale bars: 10 μm in B,C; 200 μm in D,E. (F) Quantitative analysis of PGC colocalization with Cxcl12a-expressing cells at 24 hpf. *P<0.01 versus control. Data are mean+s.e.m. |

Expression of gnb during zebrafish embryonic development. (A) Expression of gnb1a, gnb1b, gnb2, gnb4a and gnb4b during indicated stages of zebrafish embryonic development, as detected by whole-mount in situ hybridization. Lateral view, with animal pole upwards and dorsal toward s the right. Scale bars: 200 μm. (B) Expression of gnb3 and gnb5 during zebrafish embryonic development, as detected by RT-PCR. RT-PCR was performed on RNA obtained from embryos at the stages indicated. β-actin served as a loading control. |

Morpholinos (MOs) targeting gnb1 or gnb4 efficiently block translation of the corresponding ectopically expressed (GFP-tagged) proteins. (A-D) Epifluorescence images of groups of embryos injected with 100 pg gnb1a-gfp, gnb1b-gfp, gnb4a-gfp or gnb4b-gfp plasmid DNAs at the one-cell stage; GFP expression is strong at 60%-80% epiboly. (A′-D′) Co-injection of MO (4 ng) significantly suppressed the corresponding GFP expression. The following MOs (Gene-Tools) were used: gnb1a (GAGTTCGCTCATTTTCTTCTGCTTC), gnb1b (CTGGTCCAGTT CACTCATTTT CCTC), gnb4a (CCGCAACTGCTCCAGCTCACT CATG) and gnb4b (GACGCAACTGC TCCAACTCACTCAT). Scale bar: 1 mm. |
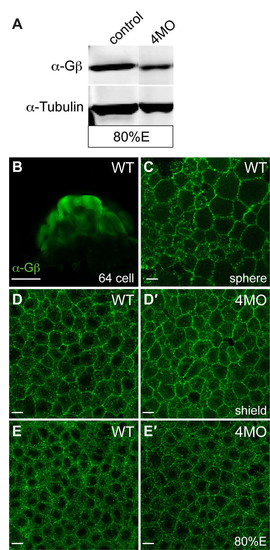
Gβ proteins are expressed during zebrafish embryonic development. (A) Western blot analysis showing the expression of Gβ proteins at 80% epiboly in embryos injected with 4MO (a combination of four MOs that target gnb1a, gnb1b, gnb4a and gnb4b, 4 ng each) was decreased, when compared with that in control uninjected embryos. α-Tubulin was used as a loading control. An anti-pan Gβ antibody (1:5,000, Santa Cruz Biotechnology) and an anti-tubulin antibody (1:10,000, Sigma) were used. (B-E′) Confocal images of wild-type embryos and 4MO-injected embryos immunostained with a pan-Gβ antibody (1:200). Maternally deposited Gβ proteins were present in embryos at the 64-cell and sphere stages (B,C). Expression of Gβ proteins at shield stage and 80% epiboly was not significantly reduced in 4MO-injected embryos (D′,E′). Scale bars: 200 μm in B; 10 μm in C-E2. |
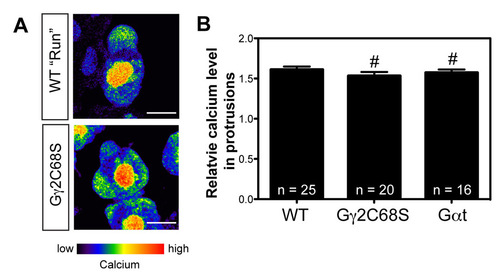
Ca2+ levels in the protrusions are normal in PGCs expressing Gαt or Gγ2C68S. (A) Pseudocolor images from confocal time-lapse movies showing wild-type and Gγ2C68S-expressing PGCs loaded with the Ca2+-sensitive fluorescent dye Oregon Green. Images are shown in the intensity-modulated display mode. The bar illustrates the range of relative Ca2+ levels (low in blue to high in red). Scale bars: 10 μm. (B) Relative Ca2+ levels in the protrusions of wild-type PGCs, and in those of PGCs expressing either Gαt or Gγ2C68S. #P>0.05 versus control. The number of PGC analyzed is indicated. |
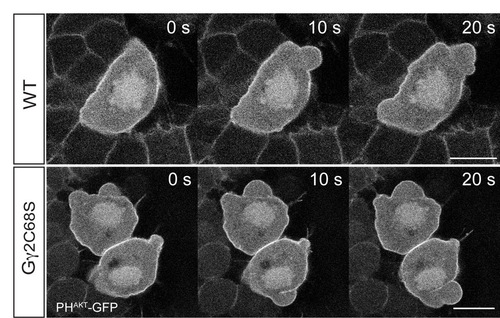
Overexpression of Gγ2C68S does not affect PI3K activity. Snapshots from confocal time-lapse experiments at 8-9 hpf, showing PGCs labeled with PHAKT-GFP. Both control and Gγ2C68S-expressing PGCs exhibited uniform PHAKT-GFP expression on the membrane. Scale bars: 10 μm. |
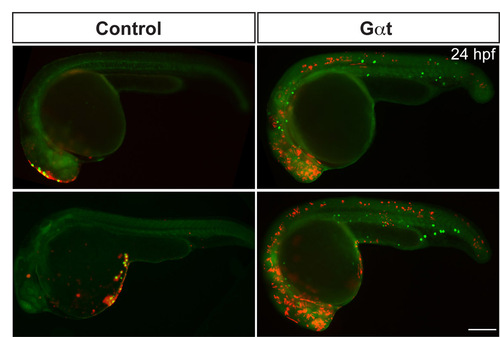
Gαt-expressing PGCs fail to respond to the chemokine Cxcl12a. Additional examples of 24 hpf embryos such as those shown in Fig. 4, demonstrating the localization of control or Gαt-expressing PGCs (green) and the cells that ectopically express Cxcl12a (red). |