
- Title
-
Both pre- and postsynaptic activity of nsf prevents degeneration of hair-cell synapses
- Authors
- Mo, W., and Nicolson, T.
- Source
- Full text @ PLoS One
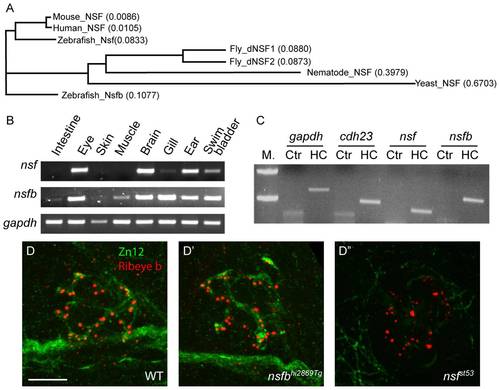
Expression of nsf and nsfb in zebrafish, and defective innervation of hair cells in nsf mutants. A, Protein sequences of NSF from yeast, nematode, fly, zebrafish, mouse and human were aligned using ClustalW to generate a phylogenic tree. The total amino acid substitutions of a specific protein are proportional to the length of each branch. The substitute rates of single amino acid were numbered in brackets after each protein. B, Detection of nsf and nsfb transcripts in adult zebrafish tissues by RT-PCR. C, RT-PCR of neuromasts isolated from 5 dpf larvae. cdh23 was a positive control as a neuromast-specific gene. M. = Marker/DNA ladder, Ctr = Control with no reverse transcriptase, HC = Hair cell. D, Larvae (4 dpf) labeled with nerve fiber-specific Zn12 (green), and anti-Ribeye b antibodies (red). The merged images showed the innervation of the first lateral line neuromast (L1) by posterior lateral line neurons. Scale bar, 10 μm. The position of the specimen is dorsal up and anterior to the left, and each image is a projection of 10 optical sections (1 μm each). Scale bar is 10 μm. |
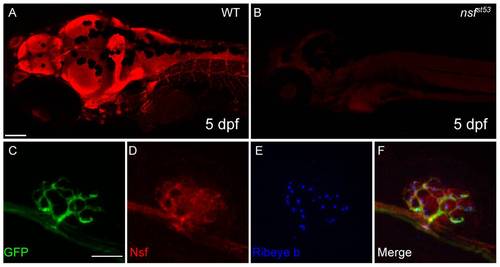
Expression of Nsf in the CNS and lateral line organ (5 dpf). A, An antibody against human NSF protein labels the larval nervous system (5 dpf). B, Labeling is absent in nsfst53 mutants. Images are projections of 5 optical sections of 10 μm thickness. Scale bar, 100 μm. C-F, Confocal projections (10×1 μm sections) of anti-NSF (red) and Ribeye b (Blue) in TgBAC(neurod:EGFP)nl1 transgenic fish. Nsf signal colocalized with anti-GFP (green) in the afferent nerve, and was also in Ribeye b-positive hair cells. Scale bar, 10 μm. EXPRESSION / LABELING:
|
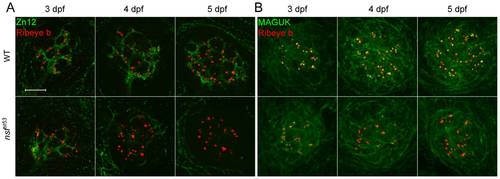
Degeneration of hair-cell synapses in nsfst53 mutants during development. A, Antibodies against Zn12 (green) and Ribeye b (red) were used to label afferent fibers and hair-cell ribbons, respectively, in wild-type (WT) and nsfst53 mutant larvae at 3, 4 and 5 dpf. B, Anti-Ribeye b (red) and MAGUK (green) labels the pre- and postsynaptic compartments respectively in neuromasts of wild-type and nsfst53 mutants (3 to 5 dpf). Scale bar: 10 μm; z-projection of 10 confocal planes (1 μm each). EXPRESSION / LABELING:
|
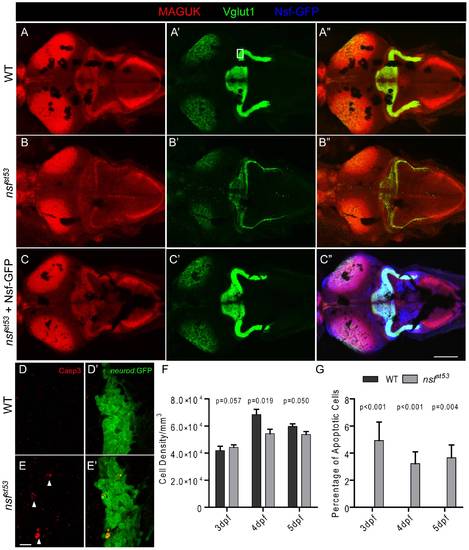
Reduction of glutamatergic synapses in the CNS of nsfst53 mutants (5 dpf). Representative z-projections of the optic tectum and cerebellar region from a top view are shown. Wild-type (A), nsfst53 mutant (B), and nsfst53 mutant in Tg(-5neurod:nsf-GFP)vo1 background (C), which expresses Nsf-GFP (Blue) in various neurons, were labeled with Vglut1 and MAGUK antibody labeling. Scale bar: 100 μm; z-projection of 15 confocal planes (10 μm each). D-E2, Magnified views from the boxed region in panel A′. Activated Caspase 3 (Casp3) antibody was used to label apoptotic cells (arrow heads) in the cerebellar region, and GFP signals from TgBAC(neurod:EGFP)nl1 fish were used to identify neurons, likely the Purkinje cells, in the cerebellum. F, Cell density (3 dpf, 41875.0±3287.4, n = 4; 4 dpf, 68500.0±3840.6, n = 5; 5 dpf, 59687.5±1856.3, n = 8 in wild-type and 3 dpf, 44285.7±1867.2, n = 7; 4 dpf, 54375.0±3264.7, n = 8; 5 dpf, 53750.0±2116.4, n = 6 in nsfst53) and (G) the rate of apoptosis in the cerebellum of wild-type (0% for 3 dpf to 5 dpf, n = 8) and nsfst53 mutants (3 dpf, 4.3±1.3%; 4 dpf, 3.2±0.9%; 5 dpf, 3.1±1.0%, n = 8). P values compare nsfst53 mutants to their wild-type siblings at the same developmental stage. EXPRESSION / LABELING:
|
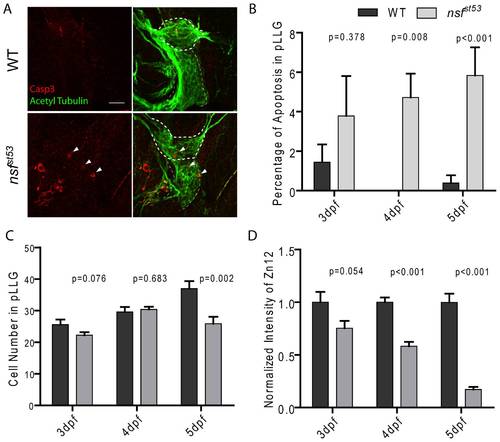
Apoptosis in nsfst53 mutants (5 dpf). Representative z-projections of the pLLG (thick dashes) and vagal ganglion (thin dashes) are shown in (A). In WT and nsfst53 mutants, apoptotic cells (arrow heads) were labeled by Casp3 antibody (red), and neurons were labeled by acetylated Tubulin antibody (green). Scale bar: 20 μm. Images shown in all panels are 6 z-stacks of 1.5 µm. B, The percentage of apoptosis in the pLLG of both wild-type and nsfst53 mutant larvae (in wild-type the percentage apoptosis are 1.4 ±0.9, n = 5, 0.0 ±0.0, n = 8 and 0.4 ±0.4, n = 8 from 3 dpf to 5 dpf respectively; 4.8 ±2.0, n = 7, 4.7 ±1.2, n = 7, and 5.8 ±1.4, n = 7 in nsfst53 mutants). C, Cell numbers of the pLLG in wild-type increased from 25.6 ±1.6, n = 5 at 3 dpf to 29.6 ±1.5, n = 5 at 4 dpf and reached 37.0 ±2.3, n = 8 at 5 dpf, while the numbers changed from 22.3 ±0.9, n = 8 to 30.4 ±0.8, n = 8 and then to 25.9 ±2.2, n = 7 in nsfst53 mutants. D, The ratio of the intensity of Zn12 labeling (Figure 3A) of nsfst53 to wild-type labeling declined from 3 dpf to 5 dpf (76.2 ±9.5, n = 6, 58.2 ±4.1, n = 5, and 17.2 ±2.4, n = 7). |
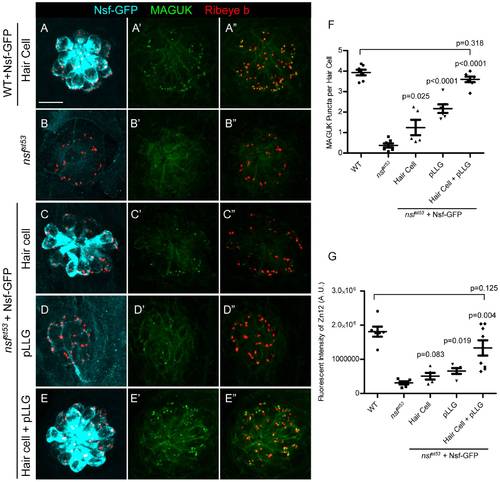
Nsf function is required in both pre- and postsynaptic cells to stabilize afferent innervation of hair cells. A-E′′, Representative z-projections of a single neuromast from a top-down view (5 dpf). Wild-type (A), nsfst53 mutants (B), and nsfst53 mutants with Nsf-GFP expressed in hair cells (C), pLLG (D), or in both hair cells and pLLG (E) were labeled by antibodies against GFP (pseudo-colored light blue), MAGUK (green), and Ribeye b (red). Scale bar: 10 μm. F, The average number of MAGUK puncta per hair cell in wild-type (3.8 ±0.1, n = 7), nsfst53 mutants (0.4±0.1, n = 7), and nsfst53 mutants with hair-cell Nsf-GFP (1.2±0.4, n = 5), pLLG Nsf-GFP (2.2±0.2, n = 6), or both hair-cells and pLLG Nsf-GFP (3. 6±0.1, n = 7). G, Zebrafish larvae were stained with Zn12 and Ribeye b antibody. The fluorescent intensity (A.U.) of Zn12 was quantified in wild-type (1.813e6±147069, n = 6), nsfst53 mutants (311769±43541, n = 6), and nsfst53 mutants with Nsf-GFP rescued in hair cells (507787±97798, n = 5), pLLG (659674±85851, n = 5), or both hair cells and pLLG (1.335e6±223319, n = 8). The p-values were generated comparing the data from the nsfst53 mutant to each transgenic mutant line. EXPRESSION / LABELING:
|
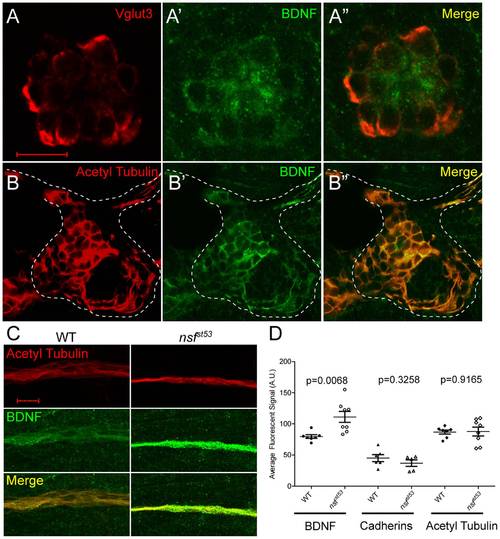
Expression of BDNF in wild-type hair cells and the pLLG, and accumulation of BDNF protein in the lateral line nerve of nsfst53 mutants. A, A single optical section of a neuromast from a wild-type zebrafish larva (5 dpf) immunolabeled for Vglut3 (A, red), BDNF (A′, green), and merged in (A′′). B, A single optical section of a wild-type pLLG, immunolabeled for acetylated Tubulin (B, red), BDNF (B′, green), and merged in (B′′). The cell bodies of the pLLG are outlined by dash lines. C, Representative z-projections of 6 sections (1 μm each) of acetylated Tubulin (red) and BDNF (green) immunolabeled lateral line nerves in wild-type and nsfst53 mutant larvae. D, The average pixel intensity (A.U.) of BDNF (WT, n = 7; nsfst53, n = 8), PAN-Cadherin (WT, n = 8; nsfst53, n = 5), and acetylated Tubulin labeling (WT, n = 7; nsfst53, n = 8) in wild-type control and nsfst53 mutants. Scale bar is 10 μm across all panels. EXPRESSION / LABELING:
|
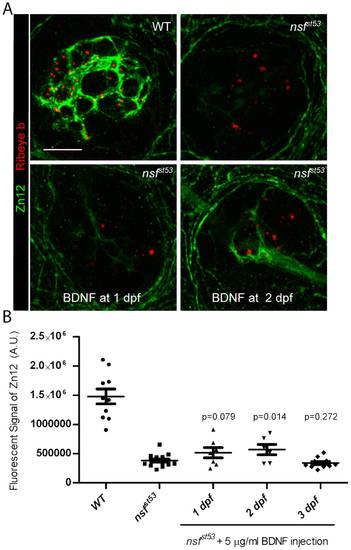
Partial rescue of synaptic contacts in nsfst53 mutants by BDNF injection at 2dpf. A, Representative z-projections of single neuromasts (4 dpf) immunolabeled for Zn12 (green) and Ribeye b (red) in wild-type, nsfst53 mutants, and nsfst53mutants injected with 5 μg/ml BDNF at 1dpf and 2dpf. 10 optical sections, 1 μm each. Scale bar: 10 μm. B, Quantification of total pixel intensity (A.U.) of Zn12 labeling in wild-type (1.478e6±128180, n = 10), nsfst53 mutants (382343±26874, n = 15), and mutants with BDNF injections at 1dpf (513236±87981, n = 7), 2dpf (568136±88664, n = 6), 3dpf (339253±25527, n = 11). Statistical tests were between uninjected control and BDNF injected mutants. EXPRESSION / LABELING:
|
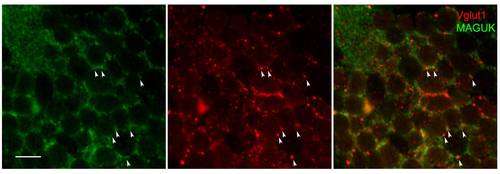
Glutamatergic synapses in the cerebellum. Magnified images of the boxed region in Figure 4A′ showed fluorescent signals from Vglut1 (red) and MAGUK (green) antibodies in Purkinje cells of the cerebellar region. Although MAGUK antibody labels both cell body and postsynaptic density in these neurons, it is possible to observe juxtaposition of MAGUK densities next to Vglut1 labeled presynaptic terminals (arrow heads). Scale bar is 10 μm. |
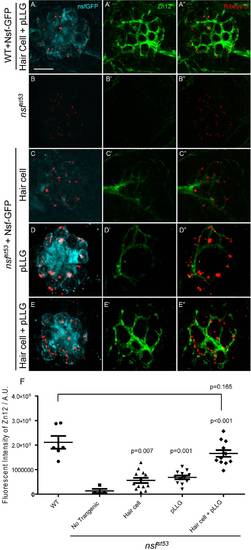
Rescue of afferent innervation by double transgenic expression of Nsf-GFP in nsfst53 mutants. A-E′′, Top-down views of the first lateral line neuromast (5 dpf) from wild-type (A), nsfst53 mutants (B), and nsfst53 mutants with Nsf-GFP expressed in hair cells (C), pLLG (D), or in both hair cells and pLLG (E). Shown is immunolabeling with antibodies against GFP (light blue), Zn12 (green), and Ribeye b (red). Scale bar: 10 μm. F, The total intensity of Zn12 antibody labeling per neuromast was quantified in wild-type (2.113e6±259343, n = 6),nsfst53 mutants (133379±80303, n = 4), and nsfst53 mutants with Nsf-GFP rescued in hair cells (559662±104829, n = 13), pLLG (684537±75475, n = 12), or both hair cells and pLLG (1.659e6±136058, n = 12).The p-values were generated comparing the data from the nsfst53 mutant to each transgenic mutant line. |
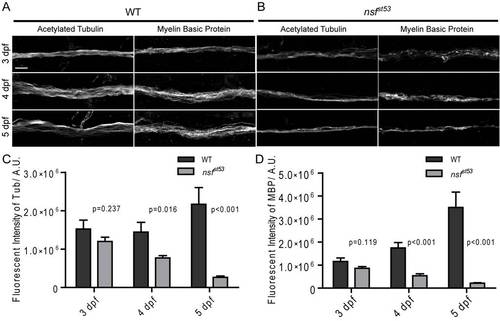
Decreased labeling of acetylated Tubulin and Myelin Basic Protein in nsfst53 mutants. A, Antibodies against acetylated Tubulin were used to label lateral line nerves in wild-type and nsfst53 mutant larvae at 3, 4 and 5 dpf. B, Anti-Myelin Basic Protein antibody labeled the myelin sheath of the lateral line nerve in both wild-type and nsfst53 mutants (3 to 5 dpf). C, The fluorescent intensity of acetylated Tubulin labeling increased over time in wild-type larvae (3 dpf, 1523307±233786; 4dpf, 1445077±252144; 5 dpf, 2170483±434340), but decreased in nsfst53 mutants (3 dpf, 1201135±110419; 4dpf, 770785±58768; 5 dpf, 264018±35511). D, The fluorescent labeling of Myelin Basic Protein displayed a dramatic increase in wild-type (3 dpf, 1155025±158382; 4dpf, 1746149±232916; 5 dpf, 3501120±670992), but significantly decreased in nsfst53 mutants (3 dpf, 860546±74798; 4dpf, 538577±85907; 5 dpf, 212506±24043). Scale bar: 10 μm; z-projection of 5 confocal planes (1 μm each). |
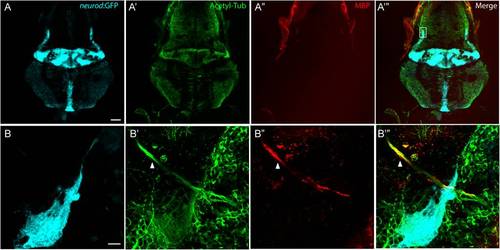
Myelin Basic Protein expresses in peripheral nerves, but not in the CNS. A-A′′′, A representative top-down projection of a zebrafish brain at 5 dpf labeled by GFP in the TgBAC(neurod:EGFP)nl1 background (A, light blue), antibodies against acetylated Tublin (Acetyl Tub, A′, green) and Myelin Basic Protein (MBP, A′′, red). MBP protein was not detected in the CNS. Scale bar: 100 μm. B-B′′′, Close up of the boxed region in panel A′′′. Although MBP fluorescence was associated with nerve fibers from the anterior lateral line ganglion (arrow head), there was no labeling of MBP in nerve fibers in the cerebellar region (highlighted by GFP expression). Scale bar: 10 μm. |