
- Title
-
Distinct phases of Wnt/β-catenin signaling direct cardiomyocyte formation in zebrafish
- Authors
- Dohn, T.E., and Waxman, J.S.
- Source
- Full text @ Dev. Biol.

Effects of increased Wnt signaling on CM differentiation markers. (A–F) myl7, (G–L) vmhc and (M–R) amhc expression in representative HCSEs and embryos when Wnt signaling is increased using the Tg(hsp70l:wnt8a-GFP)w34 line at the designated stages. Increased Wnt signaling promoted (B,H,N) and then inhibited (C–E,I–K,O–Q) the expression of CM differentiation markers when Wnt signaling was increased prior to gastrulation at the sphere (SP) stage and from the initiation of gastrulation [shield (SH)] through early somitogenesis. (F,L,R) Increasing Wnt signaling at 16 s does not overtly affect CM differentiation markers. (S) Graph indicating the fold difference in areas of cardiac differentiation marker expression. Asterisks indicate a statistical difference in the areas from HCSEs and GFP + embryos in Supplemental Table 1 according to Student′s t-test. Images in all figures are dorsal views with anterior up, unless otherwise indicated. |

Wnt signaling is necessary for CM formation in the pregastrula embryo. (A–F) myl7, (G–L) vmhc and (M–R) amhc expression in representative HCSEs and embryos when Wnt signaling is decreased using the Tg(hsp70l:dkk1-GFP)w32 line at the designated stages. (B,H,N) Wnt signaling is necessary prior to gastrulation to promote ventricular and atrial marker expressions. (C, I) Decreasing Wnt signaling at the initiation of gastrulation (shield stage) causes aberrant morphology of CMs expressing myl7 and vmhc. (O) Decreasing Wnt signaling at the initiation of gastrulation reduces the amount of cells expressing amhc. (D–F,J–L,P–R) The expression of CM differentiation markers is not affected when Wnt signaling is decreased from TB through 16 s. (S) Graph indicating the relative difference in area of cells expressing these markers. Asterisks indicate a statistical difference in the areas from HCSEs and GFP + embryos in Supplemental Table 1 according to Student′s t-test. |

Zebrafish Wnt8a paralogs are required to promote proper CM formation. (A,D,G) Control uninjected embryos. (B,E,H) Embryos depleted of wnt8a.1 and wnt8a.2 display a reduced mount of cells expressing myl7, vmhc and amhc. (C,F,I) Embryos injected with wnt8a.1 mRNA display increased numbers of cells expressing myl7, vmhc and amhc. |

Increased Wnt signaling at the TB stage causes a loss of nkx2.5 expression after the 14 somite stage. (A,C) HCSEs. (B,D) GFP + sibling embryos. Expression of nkx2.5 is normal in embryos at the 14 s stage after increasing Wnt signaling at the TB stage (B; 100%, n = 27), compared to HCSEs (A; n = 38). (C) nkx2.5 expression in HCSEs (n = 21). (D) Expression of nkx2.5 is lost by 20 s (100% had severely reduced nkx2.5 expression, n = 27) in GFP + embryos after heat-shock at the TB stage. There are diffuse nkx2.5 expressing cells at the midline (large arrowhead). Posterior pharyngeal arch staining appears increased in embryos with increased Wnt signaling at the TB stage (small arrowheads). (E) qPCR analysis of nkx2.5 expression indicates that total nkx2.5 expression is reduced in 20–22 s stage GFP + embryos after increasing Wnt signaling at the TB stage. |

Increased Wnt signaling at the TB stage causes cell death independent of Caspase-3 activation. (A,C) HCSEs. (B,D) GFP + sibling embryos. (A,B) Embryos at 20 s with AO staining to detect dying cells. There is increased cell death in the LPM at 20 s after increasing Wnt signaling at TB (B; small arrowhead and inset) compared to HCSEs (A; arrow and inset). Significant cell death was also observed in the anterior neural tissue (large arrowhead in B). (C,D) Embryos at 20 s with whole mount immunohistochemical analysis of activated Caspase-3. (D) Activated Caspase-3 is not detected in the LPM where AO staining is observed at 20 s after increasing Wnt signaling at the TB stage (small arrowhead). However, there is substantial activated Caspase-3 detected in the anterior neural tissues (large arrowhead), which is also observed with AO staining (B). Views in A and B are dorso-lateral. Views C and D are lateral. Lines in A–D indicate the position of the midbrain–hindbrain boundary. CPs/CMs are located immediately posterior to this boundary in the LPM. |

Increased Wnt signaling at the TB stage induces cell death in the anterior LPM. (A–C) Representative HCSE. (D–F) Representative GFP + embryo after increasing Wnt signaling at the TB stage. Hemizygous Tg(hsp70l:wnt8a-GFP)w34 fish were crossed to hemizygous Tg(kdrl:mCherry)ci5 fish to examine the position of apoptotic cells relative to endothelial cells in the LPM. Images are from a single optical plane taken with a Zeiss Axio Imager and ApoTome. In the transgenic embryo with increased Wnt signaling at the TB stage, there are AO positive apoptotic cells adjacent to the endothelial cells (arrows in D and F), while the HCSE does not have a significant cluster of apoptotic cells in the same region of the anterior LPM (A and C). Images are dorso-lateral views with anterior to the top and dorsal to the left. |
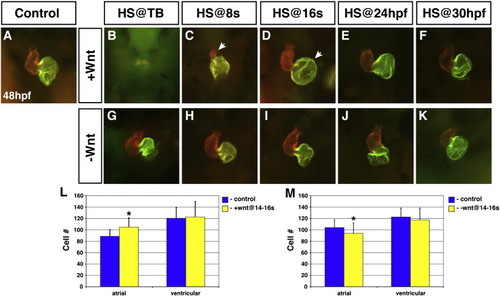
Wnt signaling is necessary and sufficient to promote atrial cell development during CM differentiation. (A) Representative HCSE. (B–F) GFP + embryos with increased Wnt signaling. (G–K) GFP + embryos with decreased Wnt signaling. Decreasing Wnt signaling from TB through 30 hpf had inconsistent and modest effects on morphology. (B,C) Increasing Wnt signaling at TB or 8 s almost eliminates and greatly reduces the size of the hearts, respectively, at 48 hpf. Arrow in C indicates the severely smaller ventricle. (D) When Wnt signaling is increased at 16 s, the atrium is significantly enlarged (arrow). Although the ventricles were dismorphic, we did not find an effect on ventricular cell number. (E) Increasing Wnt signaling at 24 hpf causes modestly enlarged atria. (F) Increasing Wnt signaling at 30 hpf no longer has a discernible effect on the heart. (L) Increasing Wnt signaling at 16 s causes a specific increase in atrial cell number. (M) Decreasing Wnt signaling at 16 s causes a modest reduction in atrial cell number. Images are frontal views. Red indicates ventricle and green indicates atrium. Asterisks indicate a significant difference in the cell number from HCSEs and GFP + embryos in Supplemental Table 3 according to Student′s t-test. |

Modulating Wnt signaling does not affect gata4 or gata6 expression in differentiating CMs. (A,C,E) HCSEs. (B,D,F) GFP + embryos with increased Wnt signaling at the 8 s and 16 s stages. (B) Increasing Wnt signaling at 8 s decreases the amount of gata6 expression (arrow). (D,F) Increasing Wnt signaling at 16 s did not discernibly affect gata6 or gata4 expression at 26 hpf. However, the endocardial morphology of gata4 expression indicates that the venous pole is expanded by 26 hpf (E,F; dashed outline). |
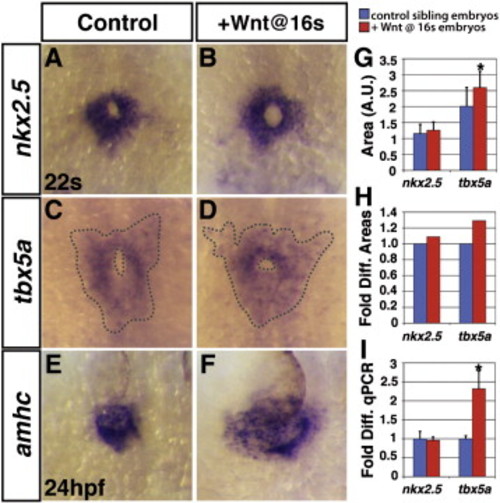
Effects of increased Wnt signaling during atrial CM differentiation are evident by the 22 somite stage. (A,C,E) HCSEs. (B,D,F) GFP + embryos with increased Wnt signaling at the 16 s stage. (B) The amount of cells expressing nkx2.5, which at 22 s primarily marks ventricular cells, is not increased when Wnt signaling is increased during cardiac differentiation. (D) The amount of cells expressing tbx5a, which is expressed in both ventricular and atrial cells, is modestly increased by 22 s. (F) When Wnt signaling is increased at 16 s, amhc expression indicates that the atria are wider compared to controls (E) by 24 hpf. (G) Areas of the amount of cells expressing nkx2.5 and tbx5a in arbitrary units. (H) Fold difference in the areas of cells expressing nkx2.5 and tbx5a. (I) qPCR analysis of nkx2.5 and tbx5a expression at 22 s. There is an increase in tbx5a greater than what is observed with the ISH analysis. However, we did observe an increase in tbx5a is expressed in the forelimb mesenchyme (data not shown). Therefore, the increase in tbx5a expression observed with qPCR likely reflects an increase in tbx5a expression from both populations. No difference in tbx5a expression in the eye was observed between HCSEs and embryos with increased Wnt signaling at the 16 s stage at the 22 s stage (data not shown). Asterisks indicates significant difference using Student′s t-test. |

Induction of Dkk-GFP and Wnt8-GFP expression from transgenic lines at the 16 s stage. As previously reported (Stoick-Cooper et al., 2007; Weidinger et al., 2005), both the Dkk and Wnt8 used for the transgenic lines are tagged with GFP facilitating the easy detection of transgenic embryos. (A,C) HCSEs. (B) Representative GFP + Tg(hsp70l:dkk1-GFP)w3 embryo 30 min after the heat-shock. For the Tg(hsp70l:dkk1-GFP)w3 embryos, fluorescence was maximal at ~ 1 h. (D) Representative GFP + Tg(hsp70l:wnt8a-GFP)w34 embryo 2 h after heat-shock. For the Tg(hsp70l:wnt8a-GFP)w34 embryos, fluorescence was maximal at ~ 2 h post-heat shock. For both transgenes, GFP expression could be detected by 30 min post-heat-shock. Overall, relative to each other, the fluorescence induced from the Dkk-GFP transgene is consistently brighter than the Wnt-GFP transgene (data not shown). Equivalent results were obtained with heat-shocks performed at the TB stage. Fluorescence in the yolk in all images is autofluorescence. |

Dkk and Wnt8 expression from transgenic lines at the 16 s stage is able to affect the expression of axin2. Axin2 is a Wnt responsive gene (Weidinger et al., 2005). (A,C) HCSEs at 20 s. (B,D) GFP + Tg(hsp70l:dkk1-GFP)w3 and Tg(hsp70l:wnt8a-GFP)w34 embryos at 20 s, respectively. (B) After decreasing Wnt signaling at the 16 s, axin2 expression is significantly downregulated relative to HCSEs (A). Arrowheads in A and B indicate the midbrain hindbrain boundary and the tip of the tail, where axin2 expression is significantly downregulated relative to HCSEs. (D) After increasing Wnt signaling at the 16 s, axin2 expression is significantly upregulated compared to HCSEs (C). Arrowheads in C and D indicate the anterior brain and spinal cord, where axin2 is upregulated relative to HCSEs. Views are lateral with anterior left. |

Zebrafish Wnt8a paralogs are necessary and sufficient for induction of aldh1a2 expression. (A,D) Uninjected sibling control embryo. (B,E) wnt8a.1 and wnt8a.2 MO injected embryo. aldh1a2 expression is reduced around the margin and in the animal–vegetal axis in wnt8a.1/wnt8a.2 morphants (arrowheads). (C,F) Embryo injected with wnt8a.1 mRNA. wnt8a.1 overexpression expands aldh1a2 expression in the dorsal region (arrowhead in C) and in the animal–vegetal axis (arrowheads in F). A–C are animal views. D–F are lateral views. Dorsal is to the right in all images. |

Decreased Wnt signaling at the sphere and shield stages results in dorsalization of embryos. (A,C,E,G,I,K) HCSEs. (B,D,F,H,J,L) Embryos with decreased Wnt signaling at the designated stages. By 80% epiboly, aldh1a2 is expressed in the dorso-lateral region, while it is excluded from the dorsal and ventral regions. Tbx6 and flh expression is excluded from the dorsal region and in the dorsal region respectively at 80% epiboly. (B,F,J) Embryos with decreased Wnt signaling at the sphere stage are severely dorsalized, as indicated by the expansion of dorso-lateral aldh1a2 expression around the ventral margin and the expanded dorsal region (compare arrows in A to B, in E to F, and in I to J). (D,H,L) Embryos with decreased Wnt signaling at the shield stage are modestly dorsalized. The dorsal region is marginally expanded (upper arrows in C,D,G,H,K,L) and the ventral region is marginally reduced (lower arrows in C and D). All images are vegetal views with dorsal up. |

Expression of a dominant-negative TCF at the TB stage does not increase the size of the heart. (A,C) HCSEs. (B,D) Hearts from GFP + Tg(hsp70l:Δtcf3-GFP)w26 embryos heat-shocked at the TB and 16 s stages. (B) Although morphology was more linear when ΔTCF-GFP was induced at the TB stage, the hearts did not appear larger. However, at the TB stage overexpression of ΔTCF-GFP causes a significant amount of cell death in embryos (not shown), potentially precluding analysis. (D) Heart from transgenic embryo when ΔTCF-GFP is induced at 16 s. All images are frontal views at 48 hpf. Red indicates ventricles and green indicates atria. |
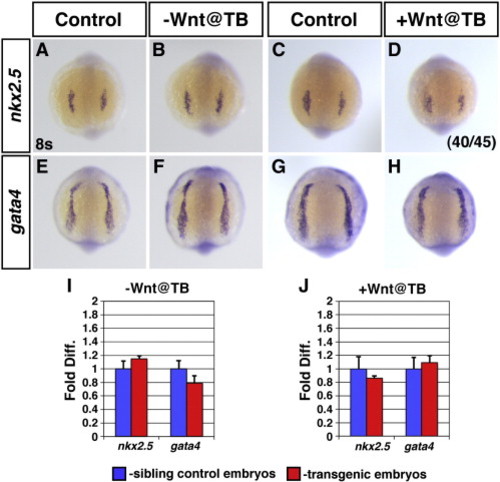
Modulation of Wnt signaling at the end of gastrulation has minimal effects on CP marker expression at 8 somites. (A,C,E,G) HCSEs. (B,F) GFP + embryos with decreased Wnt signaling at the TB stage. There is not a discernible difference in the expression of nkx2.5 (B) or gata4 (F) when these markers begin robust expression at 8 s. (D,H) GFP + embryos with increased Wnt signaling at the TB stage. (D) The majority of embryos with increased Wnt signaling at TB stage had nkx2.5 expression that was comparable to HCSEs. (H) There is not a discernible difference in the expression of gata4 at 8 s when Wnt signaling is increased at TB stage. (I,J) qPCR analysis of nkx2.5 and gata4 expression in embryos at the 8 s stage after modulating Wnt signaling at the TB stage. There is no difference in the expression levels of these CP marker genes relative to HCSEs. |
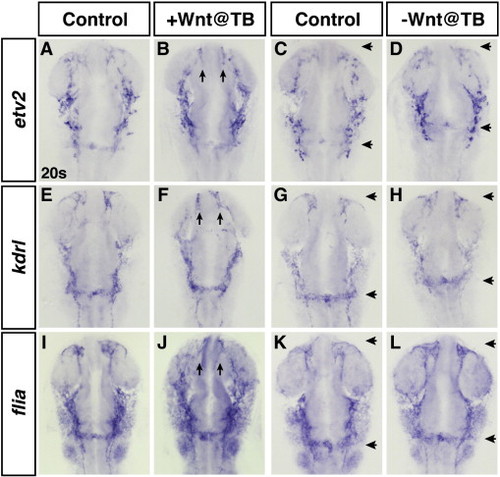
Modulation of Wnt signaling at the TB stage does not significantly affect hemangioblast and endothelial marker genes. (A,C,E,G,I,K) HCSEs. (B,D,F,H,J,L) GFP + embryos. Increased Wnt signaling at the TB stage does not lead to a discernible increase in etv2 (B), a hemangioblast marker, or kdrl (F) or fli1a (J), vascular markers. Arrows in B, F, and J indicate aberrant formation of anterior cerebral veins. (D,H,L) Embryos with decreased Wnt signaling at the TB stage. Decreased Wnt signaling does not cause a discernible decrease in etv2 (D), kdrl (H) or fli1a (L). Although the specification of these lineages does not appear affected, there is a rostral shift of the mandibular arch and endocardial knot (distance between arrows in D,H,L compared to C,G,K). |
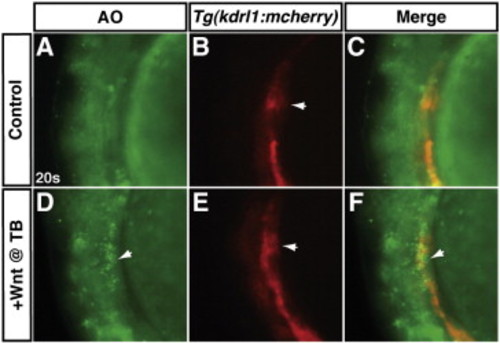
Increased Wnt signaling at the TB stage induces cell death at the same anatomical position of the anterior LPM as endothelial cells. (A–C) A representative HCSE. (D–F) A representative GFP + embryo after increasing Wnt signaling at the TB stage. To examine the position of apoptotic cells relative to endothelial cells of the LPM, hemizygous Tg(hsp70l:wnt8a-GFP)w34 fish were crossed to hemizygous Tg(kdrl:mCherry)ci5 fish as in Fig. 7. In a transgenic embryo after Wnt signaling was increased at the TB stage, there are apoptotic cells (arrows in D and F) adjacent to the endothelials in the anterior LPM (arrows in B and E). The HCSE does not have a significant amount of apoptotic cells in the same region of the anterior LPM. The anatomical position of these dying cells and endothelial cells is reminiscent of the more dorsal position of CMs relative to the endothelial cells reported in Bussmann et al. (2007). Arrow in B indicates endothelial cells that are more medial endocardial precursors. Images are lateral views with anterior to the top and dorsal to the left. |

Decreasing Wnt signaling at the 8 s and 16 s stages does not affect gata4 or gata6 expression in differentiating CMs. (A,C,E) HCSEs. (B,D,F) GFP + embryos with decreased Wnt signaling. There was not a difference in gata4 or gata6 expression or heart morphology at 26 hpf when Wnt signaling was decreased at 8 s (B) or 16 s (D,F). |
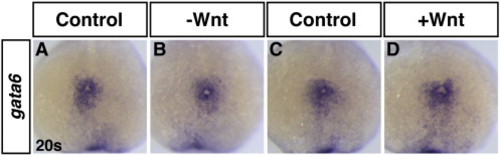
Modulation of Wnt signaling does not affect gata6 expression at the 20 s stage. (A,C) HCSEs. (B) GFP + embryo with decreased Wnt signaling. (D) GFP + embryo with increased Wnt signaling. |
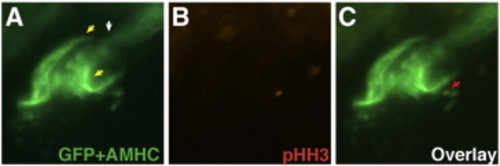
pHH3 marked proliferating cell in a zebrafish heart. Representative heart from Tg(hsp70l:wnt8a-GFP)w34;Tg(kdrl:nlsEGFP)zf109bv embryo stained for pHH3 (red) and S46 (AMHC; green) at 26 hpf after heat-shock at 16s. (A) Nuclear GFP marking the endothelial cells (white arrow) is internal to the AMHC (yellow arrows) expressing atrial myocardial cells. (B) A single cell is stained for pHH3. (C) Overlay indicating that the single cell positive for pHH3 (red arrow) is an endothelial cell. There was not a difference in the number of embryos with pHH3 positive myocardial cells or pHH3 positive cells per embryo (see Supplemental Tables 5 and 6). pHH3 marked proliferating cell in a zebrafish heart. Representative heart from Tg(hsp70l:wnt8a-GFP)w34;Tg(kdrl:nlsEGFP)zf109bv embryo stained for pHH3 (red) and S46 (AMHC; green) at 26 hpf after heat-shock at 16s. (A) Nuclear GFP marking the endothelial cells (white arrow) is internal to the AMHC (yellow arrows) expressing atrial myocardial cells. (B) A single cell is stained for pHH3. (C) Overlay indicating that the single cell positive for pHH3 (red arrow) is an endothelial cell. There was not a difference in the number of embryos with pHH3 positive myocardial cells or pHH3 positive cells per embryo (see Supplemental Tables 5 and 6). |
Reprinted from Developmental Biology, 361(2), Dohn, T.E., and Waxman, J.S., Distinct phases of Wnt/β-catenin signaling direct cardiomyocyte formation in zebrafish, 364-76, Copyright (2012) with permission from Elsevier. Full text @ Dev. Biol.