
- Title
-
Requirement for Pdx1 in specification of latent endocrine progenitors in zebrafish
- Authors
- Kimmel, R.A., Onder, L., Wilfinger, A., Ellertsdottir, E., and Meyer, D.
- Source
- Full text @ BMC Biol.
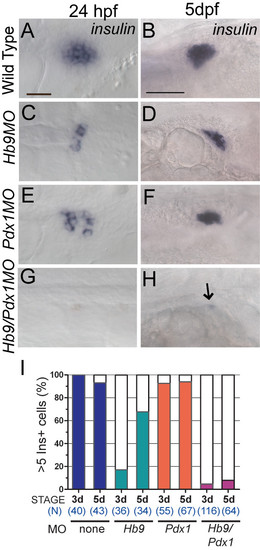
ins mRNA expression in hb9 and pdx1 morphants. In situ detection of ins mRNA in wild-type embryos (A,B), hb9 morphants (C,D), pdx1 morphants (E,F) and hb9/pdx1 double morphants (G,H) at 24 h post fertilization (hpf) and 5 days post fertilization (dpf). In hb9 and pdx1 morphants the number of ins expressing cells is strongly reduced at 24 hpf as compared to control embryos (A,C,E) but has substantially increased by 5 dpf (D,F). (G,H) ins expression is missing in most double morphants (arrow in H marks a single ins positive cell). Embryos are shown from ventral (24 hpf) and lateral (5 dpf) view with anterior to the right. Scale bars correspond to 20 μm (24 hpf) and 50 μm (5 dpf). (I) Proportion of embryos showing > 5 Ins+ cells in control and morphant embryos at 3 dpf and 5 dpf. Beta cells emerge between 3 dpf and 5 dpf in hb9 and pdx1 morphants, while there is persistent absence in the hb9/pdx1 double morphant. |
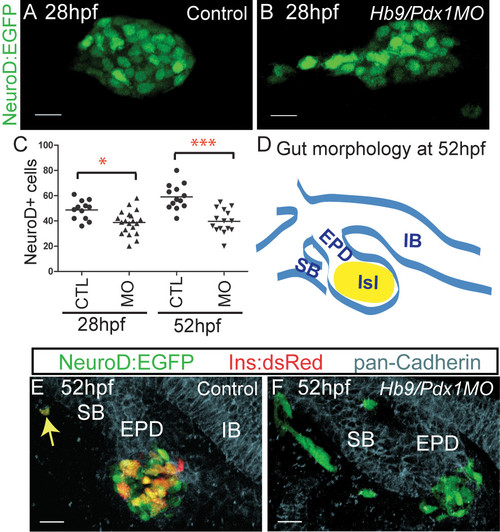
Disrupted precursor specification and differentiation in hb9/pdx1 double morphants. (A,B) Projections of confocal image stacks of native enhanced green fluorescent protein (EGFP) expression in control uninjected and in hb9/pdx1 morpholino injected TgBAC(NeuroD:EGFP)nl1 embryos at 28 h post fertilization (hpf). In morphants, the clustering of EGFP labeled cells is disrupted (B) and the number of EGFP expressing cells is reduced as compared to controls (C). By 52 hpf, NeuroD:EGFP cell numbers have increased in control embryos, but not changed in the morphants ((C), *P < 0.05, ***P < 0.001 as determined by one-way analysis of variance (ANOVA) with Bonferroni′s post test). (D) Schematic depicting overall gut morphology in 52 hpf embryos. EPD, extrapancreatic duct; IB, intestinal bulb; ISL, islet; SB, swim bladder. (E,F) Confocal image projections of control uninjected (E) and hb9/pdx1 morpholino injected (F) TgBAC(NeuroD:EGFP)nl1;Tg(ins:dsRed)m1018 embryos at 52 hpf that were costained with antibodies against pan-cadherin (light blue) to outline epithelial structures. In control embryos, EGFP+ and EGFP+/DsRed+ cells are mainly found in the islet. A rare EGFP+/DsRed+ cell is seen in a distal location (E, arrow). In double morphants, few to no EGFP/DsRed-expressing cells can be detected and many EGFP+ cells are located at ectopic positions outside the developing gut epithelium (F). Scale bar = 15 μM in all panels. All embryos are shown from ventral view, anterior to the left. |
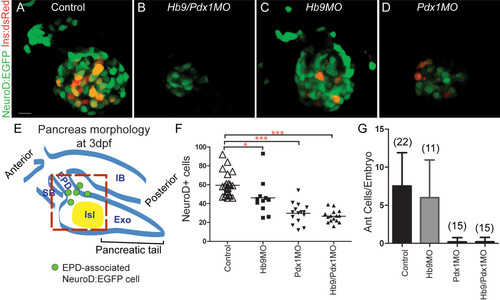
Absence of ventral bud endocrine precursors in hb9/pdx1 and pdx1 morphant embryos. (A-D) Projections of confocal stacks showing native fluorescence of 3 days post fertilization (dpf) TgBAC(NeuroD:EGFP)nl1; Tg(ins:dsRed)m1018 embryos. In uninjected control embryos (A) and in hb9 morphants (C), enhanced green fluorescent protein (EGFP)+ cells are found in the islet and in smaller numbers also anterior to the islet. In hb9/pdx1 double morphants (B) and pdx1 morphants (D), the number of islet-associated EGFP+ cells is strongly reduced and anterior cells are missing. Few Ins:DsRed cells are present in pdx1 single morphants at 3 dpf (D), reflecting slow maturation of the DsRed fluorophore. (E) Schematic of pancreas morphology at 3 dpf. The principal islet (Isl) at this stage is primarily dorsal bud derived. The ventral bud contributes new NeuroD:EGFP cells (green circles), and generates exocrine pancreas (Exo) and extrapancreatic duct (EPD). IB, intestinal bulb; SB, swim bladder. Red box delineates region included for quantitation of islet and newly emerging anterior endocrine cells. (F) Quantitation of pancreatic EGFP+ cells (*P < 0.05, ***P < 0.001 with P values determined using one-way analysis of variance (ANOVA) with Bonferroni′s post test). (G) Quantitation of anteriorly positioned EGFP+ cells in uninjected and morpholino injected embryos (error bars indicate standard deviation from the mean). Scale bar = 10 μM. EXPRESSION / LABELING:
PHENOTYPE:
|
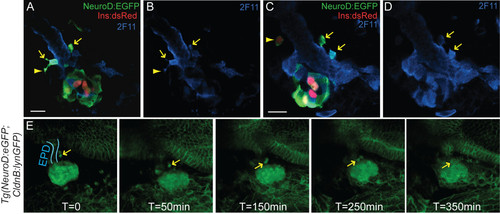
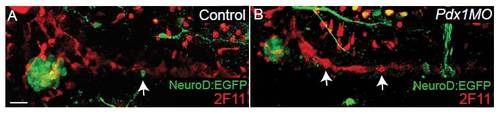
Anterior NeuroD:EGFP cells are migratory endocrine precursors. (A-D) Confocal sections of 3 days post fertilization (dpf) TgBAC(NeuroD:EGFP)nl1; Tg(ins:dsRed)m1018 embryos colabeled with antibodies against green fluorescent protein (GFP) and duct marker 2F11 (in blue). GFP+/2F11+ cells emerge from the duct (arrows), some with long projections typical of migrating cells (A, B, arrowhead). An individual cell that has separated from the duct is weakly DsRed positive (C, arrowhead). (E) Confocal image projections from a timelapse sequence of a 3 dpf TgBAC(NeuroD:EGFP)nl1;Tg(-8.0cldnb:lynEGFP)zf106 double transgenic embryo [see Additional file [8]. Membrane-linked enhanced green fluorescent protein (EGFP) in Tg(-8.0cldnb:lynEGFP)zf106 embryos delineates the gut epithelium (blue outline = extrapancreatic duct (EPD)) while robust cytoplasmic EGFP is present in NeuroD-expressing cells. Two NeuroD:EGFP cells (arrow) adjacent to the EPD migrate to the principal islet. All embryos are shown from ventral view, with the anterior to the left. Scale bar = 15 μM. EXPRESSION / LABELING:
|

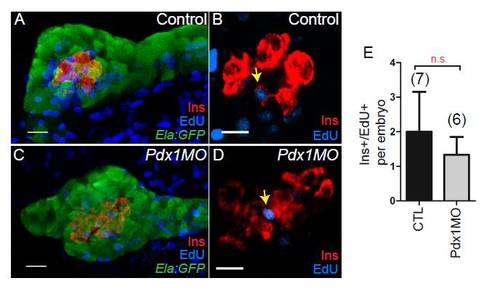
Contribution of cell proliferation to late endocrine cell expansion. TgBAC(NeuroD:EGFP)nl1 embryos incubated with EdU from 28 to 76 h post fertilization (hpf), followed by EdU detection and green fluorescent protein (GFP) antibody staining. (A, E) Confocal projections and single plane views (B-D, F-H), showing pancreatic region of control (A-D), and pdx1 morphant (E-H) embryos. (B-D) In control embryos, EdU/NeuroD:enhanced green fluorescent protein (EGFP) colabeled cells are located at the periphery of the islet (red arrowhead) and in the region of the extrapancreatic duct (EPD) (yellow arrowhead). Most islet cells are EdU- (C compared to D) and additional EdU-/NeuroD:EGFP+ cells are found along the EPD (yellow arrows). (F-H) In pdx1 morphants, few EdU/NeuroD:EGFP colabeled cells are found within the islet (red arrowhead). (I) Quantitation of EdU/NeuroD:EGFP cells per embryo in wild-type and pdx1 morphant embryos, showing mean and standard deviation. Scale bar = 10 μm. NS, not significant; P > 0.05 as determined by unpaired t test. EXPRESSION / LABELING:
PHENOTYPE:
|

Notch-responsive endocrine progenitors are absent in pdx1 morphants. (A-D) Confocal image projections of Tg(NeuroD:EGFP)nl1 embryos immunostained for green fluorescent protein (GFP) and insulin. Optical sections that obscure the posterior pancreatic tail have not been included. (E-J) Native enhanced green fluorescent protein (EGFP) expression in the pancreas of living TgBAC(NeuroD:EGFP)nl1 embryos at 5.5 days post fertilization (dpf), with overlay of concurrently acquired brightfield image. Shown are uninjected control embryos (A-D, E, F), hb9 morphants (G,H) and pdx1 morphants (I,J) treated either with vehicle (dimethylsulfoxide (DMSO)) (A,C,E,G,I) or 100 mM N-[N-(3,5-difluorophenacetyl)-L-alanyl]-S-phenylglycine t-butyl ester (DAPT) (B,D,F,H,J) from 3 to 5 dpf. DAPT treatment in control embryos leads to the induction of EGFP expression in the pancreatic tail (A,B,E,F) and of Ins in individual of these EGFP+ cells (B, D). In hb9 morphants the patterns of EGFP expression in DMSO-treated and DAPT-treated embryos are similar to that in control embryos (E-H), while pdx1 morphants show decreased EGFP+ cells in the principal islet and virtually no posterior EGFP+ cells are induced by DAPT (I,J). All embryos lateral view, anterior to the left. Scale bar = 10 μM. (K) Quantitation of NeuroD:EGFP cells induced in the pancreatic tail following DAPT treatment in control and morphant embryos. Graphed are the mean and SD for (n) number of embryos. P values were determined using one-way analysis of variance (ANOVA) with Bonferroni′s post test, ***P < 0.001. |

Exocrine pancreas development in hb9/pdx1 double morphants. Confocal image projection of the pancreas of 4 days post fertilization (dpf) embryos immunostained for carboxypeptidase A (Cpa) and insulin (Ins). hb9/pdx1 double morphant embryos (B) with severely reduced Ins (insets, (A), compared to B), show Cpa expression comparable to control embryos (A). All are in ventrolateral view. Scale bar = 30 μM. |

Pdx1 protein expression in pdx1 morphants. Confocal projections of control and pdx1 morpholino-injected embryos at 28 h post fertilization (hpf) (A-C) and 48 hpf (D-F), immunostained for Pdx1. (A-C) Control embryos express Pdx1 in the developing gut and pancreas. (D-F) pdx1 morphant embryos have no detectable Pdx1 expression. (B,E) Overlay of bright field with confocal projection of Pdx1 antibody staining, (C,F) single channel showing Pdx1 antibody. Dashed circle (E) indicates islet as determined from bright field images. Non-specific labeling by this antibody of somites lateral to the gut (asterisks) has been previously described [49]. Ventral view. Scale bar = 10 μM. Confocal projections (G,H) and single plane views (I-L) of control and pdx1 morphants at 84 hpf, immunostained for Pdx1 and carboxypeptidase A (Cpa) to indicate the exocrine pancreas. Control embryos show robust Pdx1 expression in the islet and weaker expression in the exocrine pancreas (G,I,K). pdx1 morphant embryos have low-level Pdx1 expression in the islet and exocrine pancreas (H,J,L). Lateral view, anterior to left. Scale bar = 30 μM. |

NeuroD: enhanced green fluorescent protein (EGFP) cells are endocrine precursors. (A) TgBAC(NeuroD:EGFP)nl1 embryos, mounted dorsal side up, imaged by confocal timelapse microscopy starting at 19 h post fertilization (hpf). Images were captured every 15 min. Asterisks indicate fixed points of the embryo determined from the bright field image. Anterior is to the left. (B-G) Confocal image projection of 24 hpf TgBAC(NeuroD:EGFP)nl1 embryo immunostained for green fluorescent protein (GFP) and insulin (Ins) (B-D) and GFP and somatostatin (Sst) (E-G), showing overlap of NeuroD:EGFP expression with islet hormones in a subset of cells. All are ventral view. Scale bar = 15 μM. |

Beta cell differentiation and duct development. (A,B) Single plane, ventral view of TgBAC(NeuroD:EGFP)nl1;Tg(ins:dsRed)m1018 control embryo at 72 h post fertilization (hpf). With the red channel overexposed, anterior enhanced green fluorescent protein (EGFP)+ cells with low levels of InsDsRed can be detected (arrow). (C) Confocal projection of TgBAC(NeuroD:EGFP)nl1 embryo at 72 hpf immunostained for green fluorescent protein (GFP) and insulin (Ins). The Ins signal is overexposed to show low-expressing cells anterior to the principal islet. Scale bar = 10 μM. (D-G) Confocal projection of 84 hpf Tg(-3.5nkx2.2a:GFP)ia3 embryos immunostained for GFP and Ins. GFP expression delineates developing duct in control (D,F), and pdx1 morphant (E,G) embryos. EPD, extrapancreatic duct; IPD, intrapancreatic duct. Ventral view. Scale bar = 15 μM. (H-K) Single plane views of 72 hpf Tg(-8.0cldnb:lynEGFP)zf106 embryos immunostained for Pdx1 and GFP. Control embryos show robust Pdx1 expression in the proximal pancreas and EPD (H,J), as compared to weak expression in pdx1 morphants (I,K). (J) and (K) represent the red channel only from (H) and (I). Ventral view, anterior to left. Scale bar = 10 μM. |
Proliferation during exocrine pancreas formation. Tg(ela3l:EGFP)gz2 [35] embryos labeled with EdU from 24 to 72 h post fertilization (hpf), and fixed at 84 hpf. EdU detection (blue) was followed by antibody staining to label Elastase (Ela)-expressing exocrine cells (Ela:green fluorescent protein (GFP), green) and beta cells (insulin (Ins), red). (A,C) Three-dimensional confocal projections showing composite of Ela:GFP, EdU and Ins in control (A), and pdx1 morphant embryos (C) at 84 hpf. EdU labels exocrine pancreas extensively in control and morphants. (B,D) Single plane views of embryos as in (A) and (C), showing rare cells with EdU/Ins colabeling (arrow). For clarity, the GFP channel is not shown. (E) Quantitation of EdU/Ins colabeled cells per embryo in control and pdx1 morphant embryos, showing mean and standard deviation. NS, not significant; P > 0.05 as determined by unpaired t test. Anterior is to the left. Scale bar = 15 μm. |
Larval duct morphology. Confocal projection of 6 days post fertilization (dpf) TgBAC(NeuroD:EGFP)nl1 embryos immunostained for green fluorescent protein (GFP) and 2F11. In control embryos (A), 2F11 positive cells surround GFP+ islet cells and extend into the pancreatic tail. Single NeuroD+ cells can be found in the pancreas tail (arrow). (B) pdx1 morphant embryos, with fewer GFP+ cells in the islet, have similar 2F11 expression around the islet and in the pancreatic tail (arrows). Lateral view. Scale bar = 30 μM. |