
- Title
-
Vascular endothelial and endocardial progenitors differentiate as cardiomyocytes in the absence of Etsrp/Etv2 function
- Authors
- Palencia-Desai, S., Kohli, V., Kang, J., Chi, N.C., Black, B.L., and Sumanas, S.
- Source
- Full text @ Development

Etsrp function is required for endocardium formation. (A-H) Morpholino knockdown of Etsrp results in the loss of early endocardial precursors (arrows) that migrate to the midline, as analyzed by in situ hybridization for endothelial/endocardial markers kdrl (A-D) and cdh5 (E-H) at the 19-somite (A,B,E,F) and 24-somite (C,D,G,H) stages. (I-L) etsrpy11–/– mutants lack kdrl (I,J) and nfatc1 (K,L) expression within the endocardial tube (arrows) at 24 hpf. Normal kdrl expression within the endocardium is outlined in yellow (I). nfatc1 expression in olfactory placodes is not affected (white arrowheads). (M-P) At 48 hpf (M,N) and 72 hpf (O,P) stages, nfatc1 expression in wild-type sibling embryos (M,O) is concentrated at the atrial/ventricular boundary (lower arrows) and the ventricular/outflow track boundary (upper arrows), but is sparse and diffuse in etsrpy11–/– mutants (N,P). (A-L) Ventral flat-mount view, anterior is upwards; (M-P) Ventral whole-mount view. (Q-X) Tg(fli1:GFP) (Q-T) and Tg(kdrl:GFP) (U-X) lines reveal loss of endocardial GFP in etsrpy11–/– mutants (R,T) and Etsrp morphants (V,X) at 30 hpf (insets in Q,R,U,V are shown a higher magnification in S,T,W,X, respectively). As expected, loss of Etsrp function results in the absence of intersegmental vessels (white arrowheads) and downregulation of kdrl:GFP and fli1:GFP in the axial vessels (yellow arrowheads). Lateral whole-mount view, anterior is towards the left. Arrows indicate endocardial tube. |
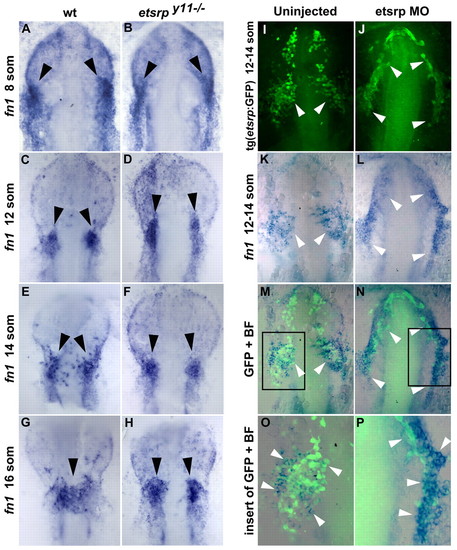
Loss of Etsrp function results in the failure of fibronectin 1-expressing endocardial precursors to migrate towards the midline. (A-D) Fibronectin 1 (fn1) expression (arrowheads) in the presumptive endocardial precursors is slightly expanded rostrally in etsrpy11–/– mutants at the 8- to 12-somite stages, as analyzed by in situ hybridization. (E-H) fn1-expressing endocardial precursors (arrowheads) migrate to the midline in wild-type sibling embryos, while they remain localized bilaterally in etsrpy11–/– mutants at the 14- to 16-somite stages. (I-P) fn1 expression largely overlaps with etsrp:GFP expression in the presumptive endocardial precursor cells (white arrowheads) in uninjected control embryos and etsrp morphants. Maximum projection image of etsrp:GFP immunofluorescence (I,J) and fn1 in situ hybridization staining (K,L). Merged images of bright-field (BF) and GFP channels (M-P). There is slight expansion of fn1 and etsrp:GFP staining in etsrp morphants. O,P are higher magnification views of the insets in M,N, respectively. (A-P) Ventral views of flat-mounted embryos, anterior is upwards. |
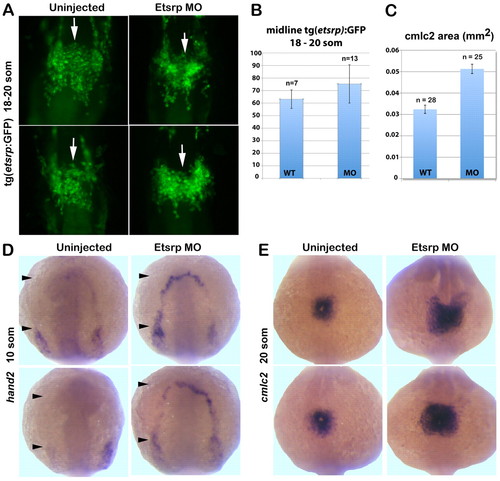
Migration of etsrp:GFP-expressing cells is not affected while myocardial markers are expanded in etsrp morphants. (A) etsrp:GFP expression in the midline population (white arrows) of presumptive endocardial progenitors is not affected in Etsrp morphants (right panels) at the 18- to 20-somite stages. Maximum intensity projection of fixed Tg(etsrp:GFP) embryos, ventral flat-mounted view, anterior is upwards. (B) At the 18- to 20-somite stages, the relative numbers of etsrp:GFP+ putative cardiac progenitors that migrate to the midline are similar between uninjected controls and etsrp morphants. Data are mean±s.e.m. (C) The calculated average area (mm2) of cmlc2 in situ hybridization staining at the 20-somite stage shows a 58% increase in etsrp morphants compared with uninjected wild-type controls depicted in E. (D) hand2 expression extends into the rostral ALPM (black arrowheads) in etsrp morphants but is absent from this region in the uninjected controls at the 10-somite stage. (E) cmlc2 expression at 20-somite stage reveals radial expansion of the cardiac plate in etsrp morphants (right panels) compared with uninjected wild-type embryos (left panels). Anterodorsal whole-mount view, anterior is upwards. |
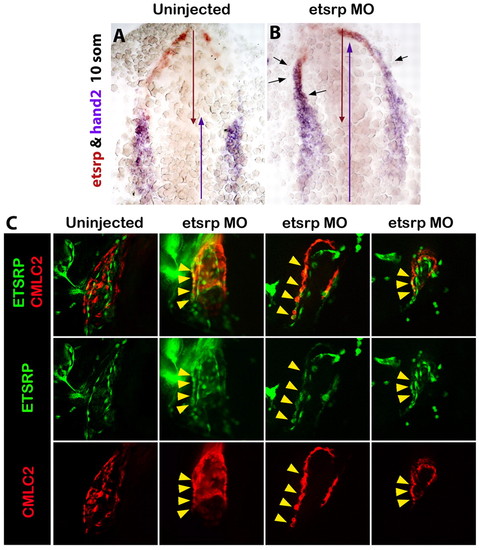
etsrp-expressing cells differentiate as cardiomyocytes in the absence of Etsrp function. (A,B) Rostrally expanded hand2 (purple) overlaps with etsrp (red) expression in Etsrp morphants (B) but not in wild-type embryos (A) at the 10-somite stage, as analyzed by two-color in situ hybridization. Red and purple arrows indicate the anterior-posterior span of etsrp and hand2 expression, respectively. Black arrows indicate the areas of overlapping expression. Ventral flat-mounted view, anterior is upwards. (C) At 30 hpf, etsrp:GFP and cmlc2:mCherry expression overlaps (yellow arrowheads) in the myocardial layer of Etsrp morphant hearts (three right columns show three different morphants) but not in control uninjected embryos (left column). Left lateral whole-mount views of fixed Tg(etsrp:GFP; cmlc2:mCherry) embryos, anterior is towards the left. Projections of only few selected slices are shown. |

Etsrp overexpression results in the loss of endogenous myocardial markers and the induction of ectopic myocardium. cmlc2 (A-D) and hand2 (E-L) expression analysis in uninjected (A,E,I) and etsrp DNA-injected (B-D,F-H,J-L) embryos. (A-D) Etsrp-overexpressing embryos exhibit fusion defects, missing cells (B-D, white arrows) and ectopic cmlc2 expression at the 20-somite stage (B,D, black arrows). (E-L) At the 10-somite stage, Etsrp overexpression results in both disruption of endogenous hand2 expression (F,G, white arrows) and induction of ectopic expression (black arrows, G,H,J-L). (A-H) Anterodorsal whole-mount view, anterior is upwards; (I-K) mid-dorsal view, anterior is upwards; (L) posterior view, dorsal is upwards. (M) Normalized ratio of myocardial marker expression in etsrp DNA-injected embryos versus wild-type embryos, as analyzed by qPCR. y-axis is shown in [log]2 scale. Data are mean±s.e.m. |

Zebrafish Nfatc1 promoter contains a conserved ETS-binding site that interacts with Etv2 protein in vitro. (A) Zebrafish and puffer fish Tetraodon nigroviridis share a conserved sequence within Nfatc1 promoter region that contains a Fox:Ets consensus site that is also present in multiple endothelial enhancers such as mef2c and flk1. The conserved sequences are located –13.9 kb and –5.4 kb from the translation start sites of zebrafish and Tetraodon Nfatc1, respectively. Pink and blue regions indicate consensus ETS and FOX binding sites, respectively. (B) Etv2 binds to the zebrafish nfatc1 site. Recombinant mouse Etv2 protein was used in EMSA with radiolabeled probes corresponding to a control ETS site from the mouse Mef2c gene (lanes 1-6) or to ETS site from the zebrafish nfatc1 gene (lanes 7-12). Lanes 1 and 7 contain unprogramed rabbit reticulocyte lysate without recombinant Etv2 protein. Etv2 bound efficiently to the control and nfatc1 ETS sites (lanes 2, 8). Binding to both sites was specifically competed by an excess of the wild-type unlabeled control (C) probe (lanes 3, 9) but not by an equivalent amount of a mutant version of the control probe (mC), which did not compete for binding to either probe (lanes 4, 10). Unlabeled zebrafish nfatc1 ETS probe (c1) also efficiently competed for binding to the control ETS site (lane 5) and to itself (lane 11). A mutant version of the nfatc1 ETS probe in which the ETS consensus was disrupted (mc1) did not compete for binding to either probe (lanes 6, 12). A plus sign indicates addition of lysate containing recombinant Etv2. A minus sign indicates lysate without recombinant Etv2 in the top row and indicates no addition of ETS site competitor in the lower row. |

foxc1a function is required for the initiation of endocardial development but not for inhibition of myocardial development. (A-H) hand2 (A-D) and cmlc2 (E-H) expression is not affected in Foxc1a morphant embryos, as analyzed by in situ hybridization at the 10-somite (A-D) and 20-somite (E-H) stages. (I-L) nfatc1 expression (arrows) is reduced moderately at low foxc1a MO doses of 1.5 ng (J) and severely at higher doses of 3 ng and 4 ng (K,L) as detected by in situ hybridization. (A-L) Flat-mounted ventral views, anterior is upwards. (M) The severity and number of morphant embryos exhibiting endocardial reduction of nfatc1 increases with the dose of foxc1a morpholino, while myocardial hand2 and cmlc2 expression is not affected significantly. PHENOTYPE:
|

Simultaneous Foxc1a and Etsrp knockdown affects endocardial but not myocardial development. (A-L) Endocardial markers kdrl:GFP at 30 hpf (A-D, arrows), kdrl at the 20-somite stage (E-H, arrows) and nfatc1 at 30 hpf (I-L, arrows) show no or only a slight reduction in expression in embryos injected with low doses of either 2 ng Etsrp MO (B,F,J) or 2 ng Foxc1a MO (C,G,K) compared with uninjected controls (A,E,I). However, upon simultaneous knockdown of Etsrp and Foxc1a, levels of all of these endocardial markers are severely reduced (D,H,L). (M-T) Myocardial hand2 expression at the 10-somite stage (M-P, arrows show anterior border) and cmlc2 at the 20-somite stage (Q-T) are not significantly affected in 2 ng etsrp MO-injected (N,R), 2 ng Foxc1a MO-injected (O,S) or Etsrp/Foxc1a MO co-injected (P,T) embryos compared with uninjected controls (M,Q). (A-D) Whole-mount fluorescent images of fixed Tg(kdrl:GFP) embryos at 30 hpf, anterior is towards the left, dorsal is upwards. (E-P) Ventral flat-mount view of in situ hybridization analysis, anterior is upwards. (Q-T) Anterodorsal whole-mount view, anterior is upwards. (U) Phenotypic distribution of endocardial kdrl:GFP, kdrl, nfatc1 and myocardial hand2 expression in etsrp, foxc1a and etsrp/foxc1a MO-injected embryos. The blue bars represent no change, whereas the green and red bars indicate mild and severe reduction in endocardial expression, respectively. Note that for kdrl:GFP and kdrl expression, normal or mildly reduced categories are combined and shown in dark green because it was difficult to distinguish the two categories. PHENOTYPE:
|

Analysis of endocardial fli1:GFP in the etsrpy11 line at 30 hpf. Some etsrpy11-/- embryos show incomplete penetrance of endocardial phenotype. (A) Phenotypically wild-type siblings of y11-/- mutants have normal trunk vasculature (yellow arrowheads) and endocardium (white arrowhead). (B,C) Tg(fli1:GFP); etsrpy11-/- mutants, identified by the lack of intersegmental vessels (yellow arrowheads), display a range of endocardial phenotypes, including severely reduced/absent endocardium (B) and moderately reduced/thin endocardium (C). |
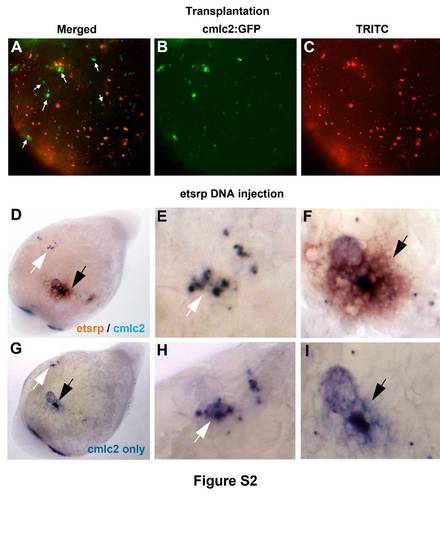
Etsrp overexpression induces ectopic cmlc2 expression in a cell non-autonomous manner. (A-C) Mosaic analysis of cmlc2:GFP expression in etsrp DNA-overexpressing embryos. Cells from cmlc2:GFP transgenic embryos injected with etsrp DNA and TRITC-dextran mixture were transplanted into uninjected cmlc2:GFP embryos at the sphere stage. Embryos were analyzed at 24 hpf for cmlc2:GFP (green) and TRITC (red) fluorescence. Merged (A), GFP (B) and TRITC (C) channels are shown. Ventral view of cells over the yolk region, anterior is upwards. Note that multiple ectopic cmlc2:GFP cells (A, arrows) do not have TRITC fluorescence. (D-F) Two-color in situ hybridization analysis of cmlc2 (blue) and etsrp (red) colocalization in etsrp DNA-injected embryos, which results in mosaic pattern of etsrp overexpression. In many cases, ectopic cmlc2-expressing cells do not overlap with etsrp expression as analyzed at the 20-somite stage. An embryo shown has both, non-overlapping (white arrow) and overlapping (black arrow) cells. Ventral view, anterior is towards the lower left. (E,F) Higher magnification views. Ectopic cmlc2/etsrp double staining in F is surrounded by brown etsrp-only stained cells. (G-I) Presence of double staining was confirmed by washing out stained embryos in ethanol, which dissolves brown iodonitrotetrazolium chloride stain but not blue nitrotetrazolium blue chloride stain. The same embryo shown as in D-F, mounting angle may be slightly different. Compare staining in E with H and F with I. |

Foxc1a MO-injected embryos display defects in somitogenesis. (A-C) foxc1a MO injection(4 ng) results in 68% of embryos (n=41) showing somites of reduced height and 27% of embryos displaying severely reduced somites, similar to the previous reports (Topczewska et al., 2001). DIC images of embryos at the 15-somite stage. PHENOTYPE:
|

Reduction of endocardial kdrl:GFP expression in foxc1a MO-injected embryos at 30 hpf. (A) Uninjected control. (B,C) Endocardial expression of kdrl:GFP (pseudocolored in green) is moderately reduced after 1.5 ng of foxc1a MO injection (B) and endocardial development is severely reduced after 3 ng of foxc1a MO (C). (D) Percent of embryos that display reduced endocardial kdrl:GFP expression in foxc1a MO-injected embryos. PHENOTYPE:
|

A mixture of two different foxc1a MOs effectively inhibits endocardial differentiation but does not cause myocardial expansion. (A-H) hand2 (A,B) and cmlc2 (C,D) expression is not affected in Foxc1a morphant embryos, as analyzed by in situ hybridization at the 10-somite (A-D) and 20-somite (E-H) stages. (E,F) nfatc1 expression is absent in foxc1a MO cocktail-injected embryos. (G,H) kdrl:GFP endocardial expression is severely reduced in foxc1a MO cocktail-injected embryos. Endocardium was pseudocolored in green for illustration purpose. (A-H) Flat-mounted ventral views, anterior is upwards. (I) Percentages of foxc1a MO cocktail-injected embryos exhibiting defects in endocardial and myocardial marker expression. No embryos showed expansion in hand2 or cmlc2 expression. PHENOTYPE:
|