
- Title
-
Celsr3 Is Required for Normal Development of GABA Circuits in the Inner Retina
- Authors
- Lewis, A., Wilson, N., Stearns, G., Johnson, N., Nelson, R., and Brockerhoff, S.E.
- Source
- Full text @ PLoS Genet.
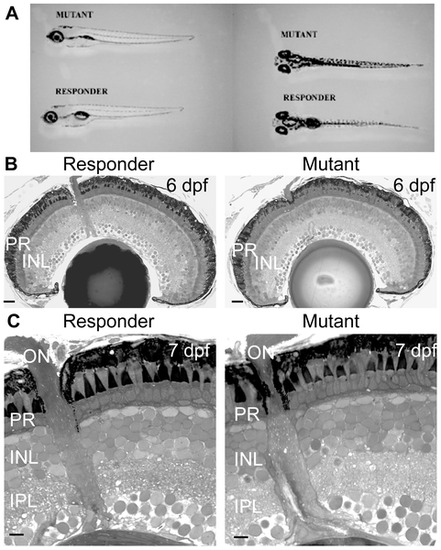
The morphology and retinal histology of the zvm7w65 mutant appears normal. A) Mutant fish at 5 dpf do not develop a swim bladder but appear otherwise normal. B and C) The histology of the eye appears normal in the zvm7w65 mutant. B) 6 dpf retinas. Scale bars are 20 μm C) magnification of 7 dpf retinas. Scale bars are 5 μm. PR, photoreceptors; INL, Inner Nuclear Layer; IPL, inner plexiform layer. PHENOTYPE:
|
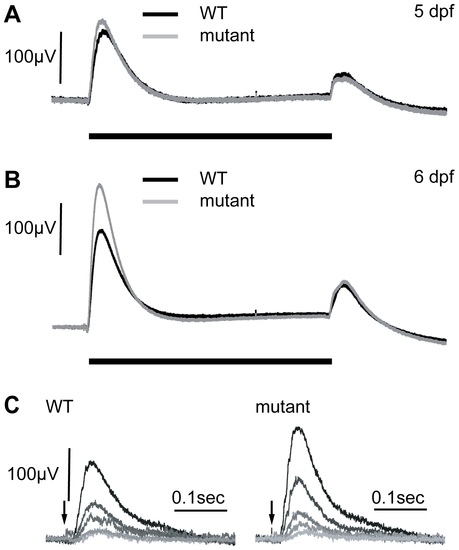
Electroretinograms show an increase in the b-wave response in mutants at 6 dpf. A) At 5 dpf, WT and zvm7w65 responses are similar. B) At 6 dpf, zvm7w65 eyes develop an increase in the b-wave. The b-wave was 176±13 µV in the WT (n = 30) and 260±48 µV in the zvm7w65 fish at 6 dpf (n = 32) (p<.001). A) and B) show an average representative trace including at least 9 animals. C) WT and zvm7w65 eyes have a similar light threshold response. Eyes were exposed to a millisecond light flash (arrow) at intensities differing by 0.5 log units (brightest = .41 mW). Amplitudes of mutant b-waves were larger at all light levels. Images show traces from a single representative animal. |
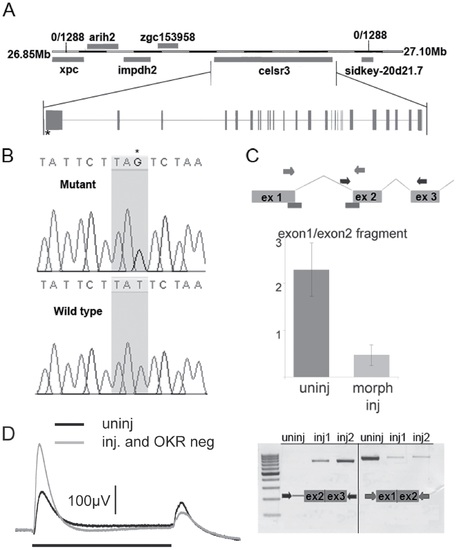
zvm7w65 has a mutation in celsr3 gene. A) A diagram of the genetic locus of celsr3. B) The zvm7w65 fish have a mutation in celsr3 that creates a stop codon at nt postion 651 of exon1. C) A diagram of predicted morpholino interaction sites (bars). Injection of splice site morpholinos results in abnormal splicing of celsr3 mRNA. Levels of correctly spliced celsr3 were determined using primers to exon1 and exon2 in a qPCR rxn (middle panel) and by agarose gel electrophoresis (bottom panel right side). Incorrect splicing can be seen in morpholino injected (inj) animals using primers in intron 1 and exon3, which do not give a product in the uninjected (uninj) animals (left bottom panel). D) Morpholino injected zvm7w65 heterozygotes that are OKR-negative have an increased b-wave (n = 4) compared to uninjected siblings. Black bar indicates 3 sec. light pulse. |
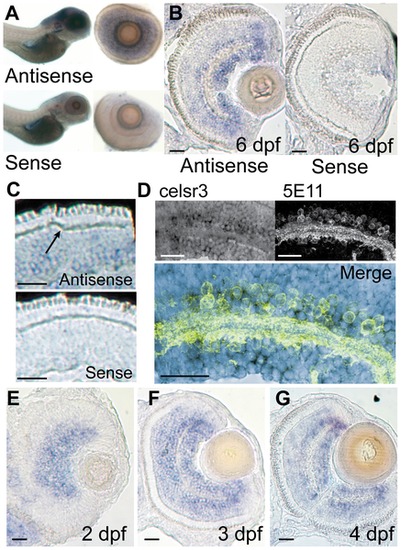
celsr3 is abundant within amacrine and ganglion cell layers of the retina. In situ hybridization was performed on WT animals using probes for exon1 of celsr3. A) Whole mounts of 6 dpf fish show localization to the brain and eye. When eyes were removed they show localization in the INL and ganglion cell layer. B and C) Cryosections of a 6 dpf eye show staining in the INL with abundance in the amacrine and ganglion cell layers. Sense controls show no staining. Arrow in C points to unlabeled horizontal cells. D) Slides were probed for celsr3 message and then probed with the anti-amacrine antibody 5E11 confirming presence of the message within amacrine cells. E–G) A time series of celsr3 message localization shows accumulation around the IPL at all ages from 2–4 dpf. Scale bars are 20 μm. |

Cell localization and IPL organization are unchanged in the celsr3 mutant. A) α-parvalbumin labels all displaced amacrine cells and a subpopulation of amacrines in the INL. B) counts of parvalbumin cells, displaced and normal amacrines were counted separately C) α-calretinin labels a subpopulation of amacrines in the INL and all ganglion cells. D) Counts of calretinin positive amacrine cells. E) α-CHAT stains a subpopulation of amacrine cells that laminate in 2 major and 2 minor sublaminae within the IPL. All sublaminae are present in the mutant. F) counts of CHAT positive amacrine cells in the INL G) Tg(ptf1a:Gal4VP16, UAS:mYFP) animals express mYFP in all amacrine and horizontal cells. H) Close ups of the IPL in Tg(ptf1a:Gal4VP16, UAS:mYFP) animals I) Images of Tg(GFAP:GFP) animals, which express GFP in all Müller cells. J) Counts of Müller cells per 50 μM. K) Tg(nyx:mYFP) animals express mYFP in the ON-bipolar cells. Scale bars are 20 μm. |
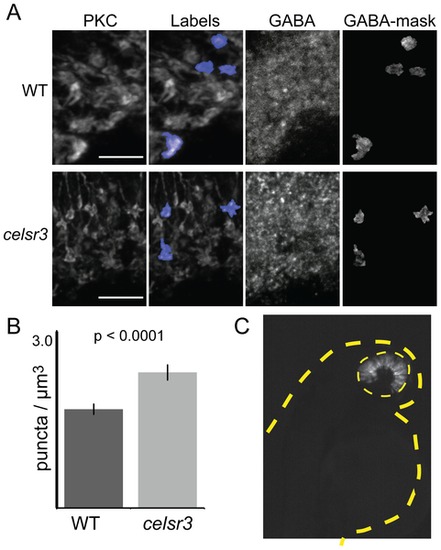
The number of GABA receptor puncta is increased on celsr3 mutant ON-bipolar terminals. A) ON-bipolar cells in cryosection were stained with anti-PKC antibodies and anti-GABAγ2. The PKC label fields were overlayed on the GABA signal, and the number of puncta was counted in each terminal rotated and visualized in 3D. Image shows merged z-stacks. Scale bars are 5 μm. B) The GABA puncta in the ON-bipolar terminals per μm3 for WT and celsr3 mutants (n = 60 terminals for each). Error bars are standard error. C) Mosaic 2 dpf larva containing WT cells in the eye (yellow dashed line) of a celsr3 mutant animal. Despite a large WT eye field transplant, this animal remained OKR negative. The tan dashed line outlines larva body. PHENOTYPE:
|

Unillustrated author statements |