
- Title
-
Restraint of Fgf8 signaling by retinoic acid signaling is required for proper heart and forelimb formation
- Authors
- Sorrell, M.R., and Waxman, J.S.
- Source
- Full text @ Dev. Biol.

Increased Fgf signaling in the post-gastrula embryo eliminates forelimbs. (A,B) Representative images from a heat-shocked control sibling embryo and a Tg(hsp70:ca-fgfr1)pd3 embryo. (A) Heat-shocked control sibling embryos had forelimbs (yellow outline). (B) Forelimbs are absent in Tg(hsp70:ca-fgfr1)pd3 embryos heat-shocked at the TBstage. (C) Graph indicating the percentage of Tg(hsp70:ca-fgfr1)pd3 embryos with forelimbs when heat-shocked at the TB (n = 10), 8s (n = 15) or 14–16s (n = 6) stages from a representative experiment. 100% of control sibling embryos heat-shocked at the TB (n = 11), 8s (n = 16) or 14–16s (n = 7) stages had forelimbs. (D) Graph indicating the percentage of DEAB treated embryos with forelimbs when treatments were initiated at the TB (n = 42), 8s (n = 46) and 14–16s (n = 27) stages. 100% (n = 85) of untreated control sibling embryos had forelimbs. |

Increased Fgf signaling in the post-gastrula embryo increases cardiac cell number. (A–D) Images of representative hearts at 48 hpf in heat-shocked control sibling embryos and Tg(hsp70:ca-fgfr1)pd3 embryos. (A,B) The hearts of heat-shocked control sibling embryos have the typical S-shaped curvature of wild-type embryos. (C,D) Hearts of Tg(hsp70:ca-fgfr1)pd3 embryos are enlarged and dysmorphic. (E) Graph indicating the fold difference of the mean cell number of heat-shocked control sibling embryos and Tg(hsp70:ca-fgfr1)pd3 embryos. Increasing Fgf signaling at the TB and 8s stage increases atrial and ventricular cell number, with 8s embryos being less sensitive to increased Fgf signaling than the TB stage. For cell counts, see Supplemental Table 1. Asterisks indicate that there was a statistically significant difference in cell number from the heat-shocked control sibling hearts used for these comparisons (Supplemental Table 1). Images are frontal views. Red indicates ventricle. Green indicates atrium. Increased Fgf signaling in the post-gastrula embryo increases cardiac cell number. (A–D) Images of representative hearts at 48 hpf in heat-shocked control sibling embryos and Tg(hsp70:ca-fgfr1)pd3 embryos. (A,B) The hearts of heat-shocked control sibling embryos have the typical S-shaped curvature of wild-type embryos. (C,D) Hearts of Tg(hsp70:ca-fgfr1)pd3 embryos are enlarged and dysmorphic. (E) Graph indicating the fold difference of the mean cell number of heat-shocked control sibling embryos and Tg(hsp70:ca-fgfr1)pd3 embryos. Increasing Fgf signaling at the TB and 8s stage increases atrial and ventricular cell number, with 8s embryos being less sensitive to increased Fgf signaling than the TB stage. For cell counts, see Supplemental Table 1. Asterisks indicate that there was a statistically significant difference in cell number from the heat-shocked control sibling hearts used for these comparisons (Supplemental Table 1). Images are frontal views. Red indicates ventricle. Green indicates atrium. |

Increased Fgf signaling expands early cardiac differentiation markers. (A–F) myl7, vmhc and amhc expression in heat-shocked control sibling embryos and Tg(hsp70:ca-fgfr1)pd3 embryos. (A) myl7, (C) vmhc and (E) amhc expression in heat-shocked control sibling embryos. The amount of cells expressing (B) myl7, (D) vmhc, and (F) amhc is increased in Tg(hsp70:ca-fgfr1)pd3 embryos with increased Fgf signaling at TB stage. (G) Graph indicating the fold difference in total area of cells expressing myl7, vmhc and amhc from heat-shocked control sibling and Tg(hsp70:ca-fgfr1)pd3 embryos at the TB and 8s stages. For area measurements, see Supplemental Table 2. Asterisks indicate that there was a statistically significant difference in the populations used for these fold comparisons (Supplemental Table 2). Images of ISH in A–F are dorsal views with anterior up. Increased Fgf signaling expands early cardiac differentiation markers. (A–F) my17, vmhc and amhc expression in heat-shocked control sibling embryos and Tg(hsp70:ca-fgfr1)pd3 embryos. (A) my17, (C) vmhc and (E) amhc expression in heat-shocked control sibling embryos. The amount of cells expressing (B) my17, (D) vmhc, and (F) amhc is increased in Tg(hsp70:ca-fgfr1)pd3 embryos with increased Fgf signaling at TB stage. (G) Graph indicating the fold difference in total area of cells expressing my17, vmhc and amhc from heat-shocked control sibling and Tg(hsp70:ca-fgfr1)pd3 embryos at the TB and 8s stages. For area measurements, see Supplemental Table 2. Asterisks indicate that there was a statistically significant difference in the populations used for these fold comparisons (Supplemental Table 2). Images of ISH in A–F are dorsal views with anterior up. |
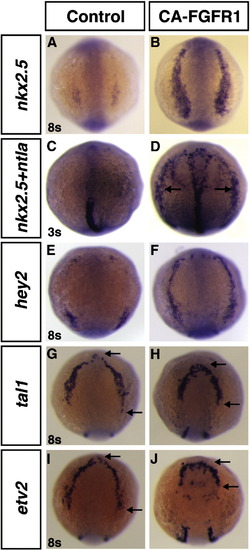
Increased Fgf signaling induces cardiac progenitor marker expression throughout the anterior LPM. Expression of nkx2.5 (A,B), nkx2.5 and ntla (C,D), hey2 (E,F), tal1 (G,H) and etv2 (I,J) in control and Tg(hsp70:ca-fgfr1)pd3 embryos heat-shocked at the TB stage. Increased Fgf signaling controls an inverse relationship between the cardiac and hematovascular progenitor markers in the anterior LPM. Increased Fgf at the TB stage signaling dramatically induces the expression of nkx2.5 and hey2 (B,F) in the anterior LPM compared to non-transgenic control siblings (A,E) at 8s. (D) nkx2.5 (arrows) is induced ectopically and precociously at the 3s when Fgf signaling is increased. Increased Fgf signaling at TB reduced the expression of the hematovascular markers tal1 and etv2 in the anterior LPM (arrows in H,J) compared to non-transgenic control siblings (arrow in G,I) at 8s. All views are dorsal with anterior up. |

Increased Fgf signaling causes a posterior expansion of cardiac progenitor markers. Heat-shocked control sibling embryos and Tg(hsp70:ca-fgfr1)pd3 embryos with increased Fgf signaling at the TB stages probed for nkx2.5 and ntla (A,C) and gata4 and ntla (B,D) at 8s. (A,B) There is minimal overlap between the posterior limit of nkx2.5 and gata4 and the anterior limit of ntla expression. (C,D) Increased Fgf signaling extends the posterior limit of nkx2.5 and gata4 expression and the overlap with the anterior limit of ntla expression. Bars in A–D indicate the amount of overlap between the posterior limits of nkx2.5 and gata4 and anterior limit of ntla. All images are dorsal views with anterior left. (E) Measurements of the length of overlap in heat-shocked control sibling and Tg(hsp70:ca-fgfr1)pd3 embryos in arbitrary units. Asterisks indicate statistically significant difference using Student′s t-test. |
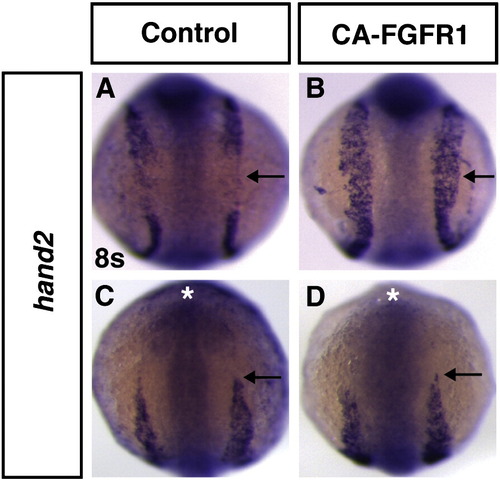
Increasing Fgf signaling results in ectopic expansion of hand2 expression. (A–D) Expression of hand2 in heat-shocked control sibling and Tg(hsp70:ca-fgfr1)pd3 embryos at 8s. (A) hand2 is expressed in anterior (cardiac) and posterior domains of the LPM, but absent in between these domains (arrow). (B) In a Tg(hsp70:ca-fgfr1)pd3 embryo with increased Fgf signaling at the TB stage, expression of hand2 is expanded into this intermediate region of the LPM (arrow). (C,D) The anterior limit of hand2 expression (arrows) is the same in heat-shocked control sibling and Tg(hsp70:ca-fgfr1)pd3 embryos with increased Fgf signaling at the TB stage. Asterisks in C and D indicate the anterior of the head. (A,B) Dorsal views of the trunk region. (C,D) Dorsal views of the anterior. In all images anterior is up. |

Increased Fgf signaling reduces posterior forelimb expression of tbx5a. (A–F) Expression of tbx5a in heat-shocked control sibling and Tg(hsp70:ca-fgfr1)pd3 embryos. (A,B) The expression of tbx5a in heat-shocked control sibling and Tg(hsp70:ca-fgfr1)pd3 embryos at 8s is indistinguishable. Compare length between arrows in A,B. (C,D) By the 12s stage, in Tg(hsp70:ca-fgfr1)pd3 embryos with increased Fgf signaling, the length of tbx5a expression is shorter (arrows). (E) By the 14s stage, the tbx5a expressing cardiac cells have begun to migrate medially, while the forelimb progenitors remain lateral and occupy a large portion of the LPM. (F) In Tg(hsp70:ca-fgfr1)pd3 embryos at the 14s stage, the tbx5a expressing cardiac progenitors are expanded relative to controls, while the tbx5a expressing forelimb progenitors are extremely reduced. The lateral edge of tbx5a expression in the LPM is outlined with a dashed blue line in A–D. The lateral edges of the cardiac and forelimb tbx5a expression domains are outlined with red and yellow dashed lines respectively in E and F. Arrows in E and F indicate the separation point between the two tbx5a expressing domains. All views are dorso-lateral with anterior to the left. |
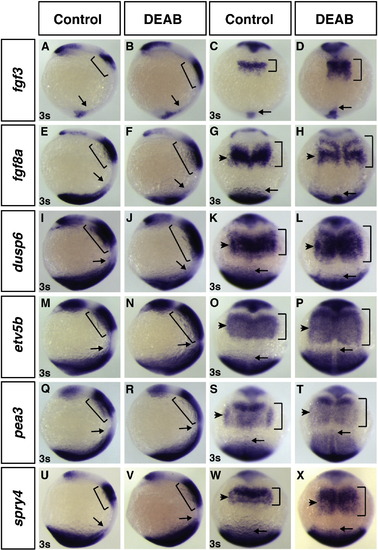
RA signaling-deficient embryos have a posterior expansion of Fgf ligands and responsive genes. Control sibling and DEAB treated embryos at 3s probed for the Fgf ligands fgf3 (A–D) and fgf8a (E–H) and the Fgf responsive genes dusp6 (I–L), etv5b (M–P), pea3 (Q–T) and spry4 (U–X). DEAB treated embryos display a posterior expansion of the Fgf ligands and Fgf responsive genes (B, D, F, H, J, L, N, P, R, T, V, X) compared to control siblings (A, C, E, G, I, K, M, O, Q, S, U, W). Bars indicate the overall length of expression within the anterior of the embryo. Arrow indicates the anterior limit of the posterior expression domains. Arrowheads in C, H, K, L, O, P, S, T, W, and X indicate LPM expression. A, B, E, F, I, J, M, N, Q, R, U, and V are lateral views with anterior up and dorsal right. C, D, G, H, K, L, O, P, S, T, W, and X are dorsal views with anterior up. |
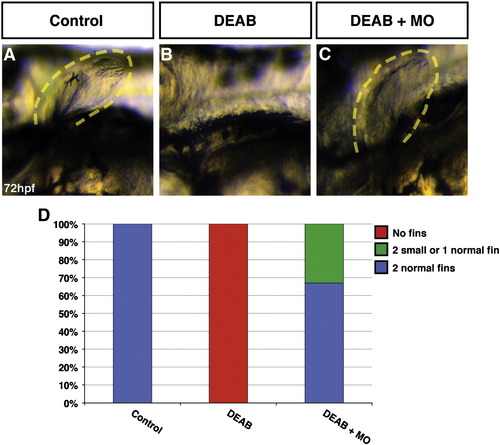
Moderate reduction of Fgf8a can rescue forelimb development in RA signaling-deficient embryos. (A) Forelimb (pectoral fin) of control sibling embryo. (B) Representative embryo treated with DEAB lacks forelimbs. (C) Representative embryo treated with DEAB and injected with 2 ng fgf8a MO mixture that has forelimbs. Views are lateral at 72 hpf. (D) Graph indicating the percentage of control sibling (n = 27) embryos, DEAB treated embryos (n = 34), and DEAB treated embryos that were also injected with 2 ng fgf8a MO mixture (n = 21) with forelimbs from a representative experiment. 100% (n = 13) of embryos injected with 2 ng fgf8a MO mixture had forelimbs (not shown). Injection of a 6 ng fgf8a MO mixture into DEAB treated embryos also restored fins as 63% (10 had forelimbs; n = 16). |

Inhibition of Fgf8a function can rescue cardiac differentiation marker expression in RA signaling-deficient embryos. Expression of myl7 at 22s in (A) control, (B) DEAB treated, (C) 2 ng fgf8a MO mixture injected, and (D) DEAB treated with 2 ng fgf8a MO mixture injected embryos. (B) Expression of myl7 is increased in DEAB treated embryos. (C) Expression of myl7 is reduced in embryos injected with the 2 ng fgf8a MO mixture. (D) Expression of myl7 is rescued in embryos treated with DEAB and injected with 2 ng fgf8a MO mixture. (E) Area of total cells expressing myl7 in control, DEAB treated, fgf8a MO mixture injected, and DEAB treated plus 2 ng fgf8a MO mixture injected embryos. See Supplemental Table 3. Asterisks indicate statistically significant difference from sibling control embryo measurements (p < 0.05) using Student′s t-test. Single experiments that examined heart and forelimb phenotypes in sibling embryos and experiments that only examined heart or forelimb phenotypes gave equivalent results (not shown). Images are dorsal views with anterior up. |
Reprinted from Developmental Biology, 358(1), Sorrell, M.R., and Waxman, J.S., Restraint of Fgf8 signaling by retinoic acid signaling is required for proper heart and forelimb formation, 44-55, Copyright (2011) with permission from Elsevier. Full text @ Dev. Biol.