
- Title
-
An evolutionarily conserved kernel of gata5, gata6, otx2 and prdm1a operates in the formation of endoderm in zebrafish
- Authors
- Tseng, W.F., Jang, T.H., Huang, C.B., and Yuh, C.H.
- Source
- Full text @ Dev. Biol.

Temporal and spatial expression profiles of gata5, gata6, otx2 and prdm1a. (A) Quantitative expression profiles of gata5, gata6, otx2 and prdm1a determined by using Q-PCR. The X-axis represents RNA molecules per embryo defined by Q-PCR. RNA was isolated from embryos at different time points, and the absolute molecular numbers per embryo are shown as a purple line for gata5, a blue line for gata6, a red line for otx2, and a green line for prdm1a. The experiments were conducted in triplicate, and the standard deviation is shown as a bar extending to both sides of the mean. (B–E) In situ hybridization of gata5, gata6, otx2 and prdm1a in wild-type embryos at 5 hpf. gata5 and gata6 are expressed in the mesendoderm and the YSL at 5 hpf. otx2 is expressed in the blastoderm at 5 hpf, and prdm1a is expressed in the blastoderm and ectoderm. Arrow indicates the location of mesendoderm lineage at the margin of blastoderm. (F–K) Co-localization of otx2, gata5 and gata6 at 5 hpf double in situ hybridization for gata6 and otx2 (F, G, H) and gata5 and gata6 (I, J, K) in wild-type embryos at 5 hpf. (F) gata6 mRNA is indicated by green fluorescence. (G) otx2 mRNA is shown by red fluorescence. (H) Merged image of F and G, indicating the co-localization of gata6 and otx2 in the mesendoderm. (I) gata5 mRNA is indicated by green fluorescence. (J) gata6 mRNA is shown by red fluorescence. (K) Merged image of I and J indicating the co-localization of gata5 and gata6 in the mesendoderm. Arrow indicates the location of mesendoderm lineage at the margin of the blastoderm. EXPRESSION / LABELING:
|

Morpholino and phenotypic characterization of morphants for germ layer progenitor cell fate specification. (A) The nucleotide sequence surrounding the translation initiation site for gata5, gata6, otx2 and prdm1a, with the MO target site highlighted. (B) Illustration of section to demonstrate the cells′ lineage. (C–G) Section double in situ hybridization with ectoderm marker (foxb1.2 shown in blue) and endoderm marker (sox32 indicated by pink) for the 5 hpf morphants injected by the control MO (C), gata5 MO (D), gata6 MO (E), prdm1a MO (F) and otx2 MO (G). MO shown in the right upper corner and scale bar indicated with a black line in the right lower corner. EXPRESSION / LABELING:
|
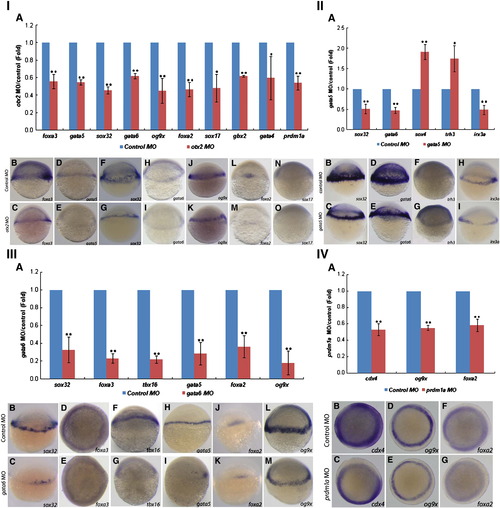
Genes that are affected after knockdown of otx2 (I), gata5 (II), gata6 (III) and prdm1a (IV) at 5 hpf. (I) otx2 MO represses many genes′ expression at 5 hpf. (II) gata5 MO affect many genes′ expression at 5 hpf. (III) gata6 MO inhibit many genes′ expression at 5 hpf. (IV) prdm1a MO inhibit the expression of cdx4, og9x and foxa2 at 5 hpf. The Q-PCR results from different morphants are shown in bar graphs. The gene expression levels in the control embryos were used as standards and are shown by blue bars. The red bars represent the extent (fold-change) to which gene expression was up- or down-regulated in morphants compared with control embryos. The results were obtained from more than three sample batches, and the standard deviations are indicated as lines extending from the mean. The statistical significance of the quantitative data was determined by the Student′s t-test. ★★, represents p < 0.01, ★, represents 0.01 < p < 0.05. I(B–O), II(B–I), III(B–M), and IV(B–G): Representative images from in situ hybridization show the domains in which the expressed genes were deregulated in morphants. Upper images: expression of the gene (name shown in the right lower corner) in the control MO-injected embryos; lower images: expression of the gene (name shown in the right lower corner) in the otx2 MO (I), gata5 MO (II), gata6 MO (III), and prdm1a MO (IV) injected embryos. EXPRESSION / LABELING:
|
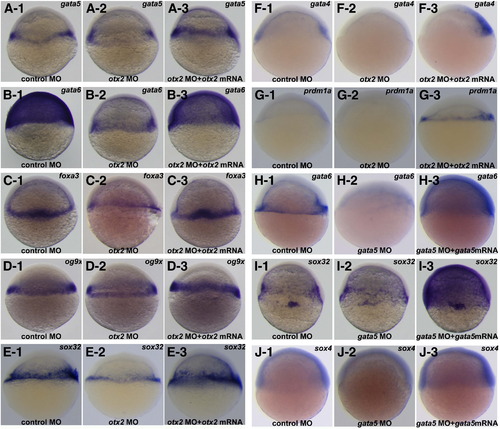
RNA rescue experiment verifying the specificity of otx2 MO and gata5 MO at 5 hpf. (A–G) The embryos were injected with control MO (1), otx2 MO (2) or both otx2 MO and otx2 mRNA (3) and using in situ hybridization to examine the expression of genes such as gata5 (A), gata6 (B), foxa3 (C), og9x (D), sox32 (E), gata4 (F) and prdm1a (G). (H–J) The embryos were injected with control MO (1), gata5 MO (2), or both gata5 MO and gata5 mRNA (3) and using in situ hybridization to examine the expression of genes such as gata6 (H), sox32 (I) and sox4 (J). Injected morpholino is shown in the bottom, and the in situ probe is indicated in the right upper corner. EXPRESSION / LABELING:
|

Endoderm-specific transcription factors are activated by overexpression of gata5, gata6 and otx2 mRNAs. The embryos were injected with control MO (1) or mRNA (2) and using in situ hybridization to examine the expression of genes such as foxa2 (A–C), sox32 (D, E), and og9x (F). Injected morpholino is shown in the left lower corner, the in situ probe is indicated in the right upper corner, and the percentage of morphants exhibited the similar pattern is shown at the right lower corner. |

The in vivo binding of Otx2 on the genomic region of gata5 and gata6 using chromatin immunoprecipitation. In vivo Otx2-binding sites were detected by chromatin immunoprecipitation using an Otx2 antibody. (A) A physical map of the gata5 regulatory modules with the number indicated the location relative to translation initiation site as + 1. The red boxes indicate the modules that are enriched by chromatin immunoprecipitation using the Otx2 antibody. The gray box indicates the module that is not enriched by chromatin immunoprecipitation using the Otx2 antibody. The gel images represent typical results from the ChIP assay. IgG and Otx indicate the PCR products from genomic DNA precipitated using either IgG or Otx2 antibody. The input is the PCR product from the total input genomic DNA. The PCR amplicon tested in each reaction is labeled. (B) A physical map of the gata6 regulatory modules with the number indicated the location relative to transcription initiation site as + 1. The gata6 regulatory modules with the modules that are enriched by chromatin immunoprecipitation using the Otx2 antibody are labeled in red, and the modules that are not enriched by ChIP using Otx2 antibody are labeled in gray. The representative gel images of the PCR products from total input genomic DNA, precipitated using IgG or Otx2 antibody. The PCR amplicon tested in each reaction is labeled at the bottom of each image. |

Functional analysis of gata5 and gata6 regulatory modules. I. The GFP expression constructs, expression territories, and the GFP images of the gata5 regulatory module. (A) Map and summarization of the results for the gata5 regulatory modules. (B) gata5-C-Bp shows GFP in the dorsal half the embryo. (C) gata5-C-Bp shows GFP in the mesendoderm and scattered expression in the ectoderm. (D) gata5-B-Bp shows GFP in the mesendoderm and scattered expression in the ectoderm. (E) gata5-Bp shows GFP in the mesendoderm. II. GFP constructs and results for gata6 and representative images of the expression pattern. (A) Map and summarization of the results for the gata6 regulatory modules. (B) gata6-B2A-Bp shows GFP in the mesendoderm and YSL. (C) gata6-BA-Bp shows GFP in the mesendoderm. (D) gata6-A′-Bp shows no GFP expression in the embryo. (E) gata6-B-Bp shows GFP in the YSL. (F) gata6-C-Bp shows GFP in the YSL. (G) gata6-D-Bp shows no GFP expression in the embryo. |

Morphology of gata5 MO1 (20 ng/embryo), gata5 MO2 (16 ng/embryo), otx2 MO1 (1.2 ng/embryo), and otx2 MO2 (1.2 ng/embryo) injected embryos at 3 dpf. (A) Selected image of control MO injected embryo which represents 21 out of 22 of control morphants. (B) Selected image of gata5 MO1 injected embryo which represents 43 out of the 61 gata5 MO1 morphants exhibited pericardial swollen and unlooped heart. (C) Selected gata5 MO2 injected embryo which represents 57 out of the 69 gata5 MO2 morphants exhibited similar heart defects. (D) Selected image of otx2 MO1 injected embryo which represents 27 out of the 58 otx2 MO1 morphants with mild defect as exhibited pericardial swollen, unlooped heart and almost normal body length. (E) Selected image represent 14 out of the 58 otx2 MO1 morphants exhibited more sever defect as pericardial swollen, unlooped heart and body length shorten. (F) Selected image of otx2 MO2 injected embryo which represents 35 out of 62 otx2 MO2 morphants with mild defect. (G) Selected image represent 23 out of the 62 otx2 MO2 morphants exhibited more server defect. |
Reprinted from Developmental Biology, 357(2), Tseng, W.F., Jang, T.H., Huang, C.B., and Yuh, C.H., An evolutionarily conserved kernel of gata5, gata6, otx2 and prdm1a operates in the formation of endoderm in zebrafish, 541-57, Copyright (2011) with permission from Elsevier. Full text @ Dev. Biol.