
- Title
-
A variant of fibroblast growth factor receptor 2 (fgfr2) regulates left-right asymmetry in zebrafish
- Authors
- Liu, D.W., Hsu, C.H., Tsai, S.M., Hsiao, C.D., and Wang, W.P.
- Source
- Full text @ PLoS One

The left-right asymmetry of visceral organs was randomized in fgfr2 morphants. The expression pattern of foxA3 in liver (l) and pancreas (p) was shown in wild type, fgfr2-ATG morphants, fgfr2-I4E5 morphants, fgfr2c morphants, fgfr2b and fgfr2c-5 mm morphants (A~D, I~K). Abnormal pattern of reverse visceral organs was also observed in these embryos (E~H, L~N). All pictures were dorsal view. The bar charts showed the percentage of left-right asymmetry of visceral organs (O). |

The laterality of heart jogging and looping was randomized in fgfr2c morphants. The development of heart was followed using Line 544 (cmlc2:EGFP/β-actin2-mCherry) transgenic fish. Normal direction of heart jogging was toward left side (A~C, L-jog). Randomization resulted in abnormal patterns of jogging (D~I, R-jog and mid-jog). Normal heart looping (J~L, D-loop) and abnormal heart looping (M~Q, L-loop and no-loop) were detected in un-injected transgenic line 544 embryos, fgfr2c and fgfr2c-5 mm morphants. All pictures were ventral-anterior view. The bar charts showed the percentage of different types of heart jogging and looping (R). A: atrium, V: ventricle. Left-right axis was indicated as labeled. |

The expression of lefty1, spaw and pitx2c were affected in fgfr2c morphants. The lefty1 was expressed in the mid line (white arrow head), heart primordium (black arrow head) and diencephalon (white arrow) of wild type (A and B) but not expressed in the corresponding regions of fgfr2c morphants (C and D). Four different expression patterns of spaw and pitx2c in LPM (left, right, bilateral and no-signal) were detected in fgfr2c morphants (black arrow, E~L). All pictures were dorsal view. The bar charts showed the percentage of different spaw and pitx2c expressing pattern in wild type and morphants (M and N). Left-right axis was indicated as labeled. |
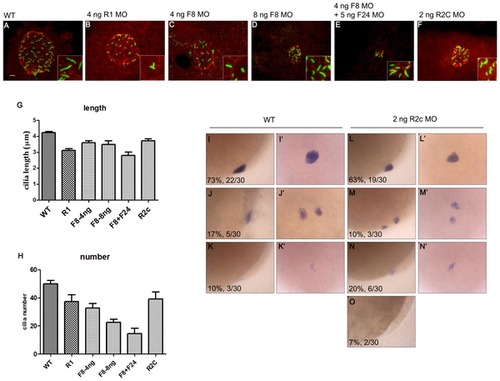
The cilia length was disrupted in fgfr2c morphants. The KV and cilia were labeled with antibodies against aPKC (red) and acetylated tubulin (green), respectively, at 10 somite-stage embryos (A~F). The cilia length was reduced in fgfr1, fgf8 morphants and fgf8/fgf24 double morphants compared to wild type embryos (A~E, G). The cilia length was also reduced in fgfr2c morphants (F~G). The cilia number was reduced in fgfr1, fgf8 morphants and fgf8/fgf24 double morphants compared to wild type embryos (A~E, H). In fgfr2c morphants, the cilia number was not significantly reduced (F, H, 39.2±4.9, P = 0.0725). Various expression patterns of foxj1a were detected in wild type embryos (lateral view, I~K; dorsal view, I2~K2) and fgfr2c morphants (lateral view, L~O; dorsal view, L2~N2) at 90% epiboly. Error bar, s.e.m. Scale bar: 10 μm. EXPRESSION / LABELING:
PHENOTYPE:
|
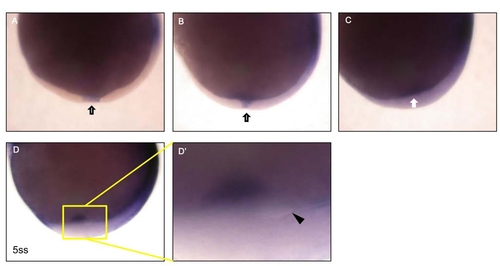
Expression pattern of fgfr2. The expression of fgfr2 was detected in marginal YSL (A~C, arrow, 95%~100% epiboly) and in the area near KV (arrowhead in D2, 5 somite-stage). Boxed area shown in panel D is enlarged in panel D2. |
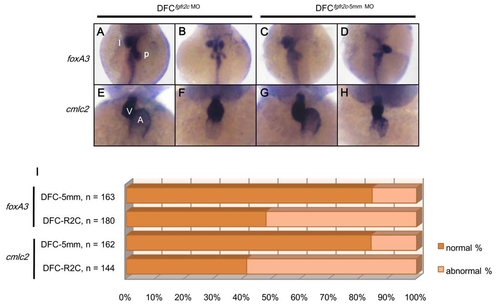
The effects of fgfr2c MO specific on DFCs. The normal expression pattern of foxA3 in liver (l) and pancreas (p) was shown in DFCfgfr2c MO and DFCfgfr2c-5 mm MO morphants (A and C). Abnormal pattern of visceral organs was also observed in these embryos (B and D). The development of heart was examined using cmlc2 probe (E~H). Normal (E and G) and abnormal heart looping (F and H) can be observed in both morphants. The bar charts showed the percentage of embryos with different expression distribution of foxA3 or cmlc2 in both morphants (I). Panel A to D were dorsal view and panel E to H were ventral-anterior view. A: atrium, V: ventricle. |

The cas expression pattern in fgfr2c morphants. Embryos at 90% epiboly were stained with cas probe for labeling DFCs. The morphology of normal DFC cluster in wild type was shown in panel A (79%, n = 140). The mild and severe disorganization of DFC pattern could also be detected. However, the percentages of abnormal pattern were increased in fgfr2c morphants (B and C, 56.9%, n = 195). |