
- Title
-
Knock-down of cathepsin D affects the retinal pigment epithelium, impairs swim-bladder ontogenesis and causes premature death in zebrafish
- Authors
- Follo, C., Ozzano, M., Mugoni, V., Castino, R., Santoro, M., and Isidoro, C.
- Source
- Full text @ PLoS One
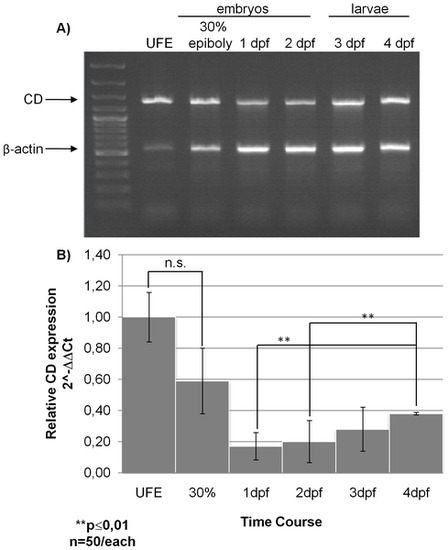
Zebrafish cathepsin D mRNA expression. A) Agarose gel electrophoresis of RT-PCR products. Total RNA was extracted from un-fertilized eggs (UFE), embryos at 30% epiboly, 1 dpf and 2 dpf, and larvae at 3 dpf and 4 dpf. Multiplex RT-PCR was performed using both zebrafish CD and β-actin 1 cDNAs specific primers into the same reaction. The products of the expected size are indicated by the arrows (the 549 bp amplicon for β-actin 1 and the 1380 bp amplicon for CD). DNA ladder was run in lane 1. Data reproduced in two other independent experiments. B) Relative transcript expression of zebrafish CD as assessed by qReal-Time PCR in UFE, embryos 30% epiboly, 1 dpf, 2 dpf and larvae 3 dpf and 4 dpf. Data and relative statistics (**, p<0.01; n.s., not significant) from two independent experiments in triplicate. |
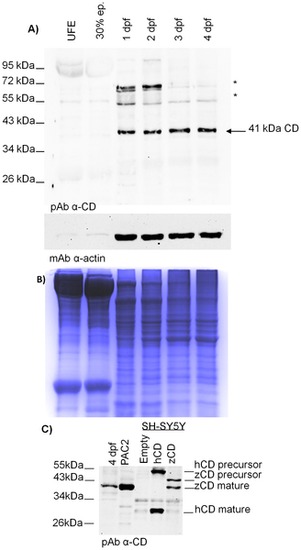
Zebrafish cathepsin D protein expression. A) Western blotting of CD in homogenates of un-fertilized eggs (UFE), embryos (at 30% epiboly, 1 dpf and 2 dpf) and larvae (at 3 dpf and 4 dpf). The filter was first probed with a polyclonal antibody against rat CD, stripped and re-probed with a monoclonal antibody against β-actin. The arrow points to the single-chain CD (41 kDa). Asterisks point to aspecific bands. The position of standard molecular weight proteins is indicated. One representative gel out of five independent experiment is shown. B) Colloidal Coomassie G-250 stained gel (after blotting) showing whole homogenate proteins of each sample loaded. C) Western blotting validation of the polyclonal anti-CD antibody against homogenates of 4 dpf larvae, PAC2 cells and SH-SY5Y cells (transfected with either the empty vector or the vector carrying the cDNA for human CD or for zebrafish CD). The position of the CD molecular forms recognized by the antibody is indicated on the right. The position of standard molecular weight is indicated on the left. Essentially a similar pattern of CD expression was obtained in two other independent experiments. |
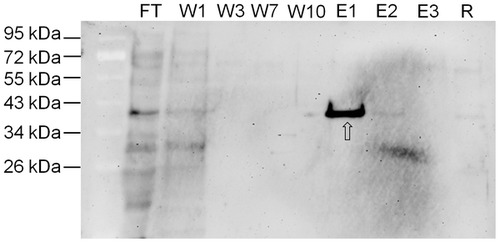
Zebrafish cathepsin D purification by affinity chromatography. Western blotting of CD purified from 4 dpf zebrafish homogenate after purification by pepstatinyl-agarose affinity chromatography. FT = flow-through; W1-3-7-10 = washing fractions; E1-2-3 = eluted fractions; R = fraction of residual proteins after elution. Fractions were desalted, concentrated, denatured in Laemmli buffer, resolved by SDS-PAGE and blotted onto nitrocellulose. The filter was incubated with polyclonal antibody against rat CD. The position of standard molecular weight proteins is indicated. The arrow points to 41 kDa zebrafish CD. EXPRESSION / LABELING:
|
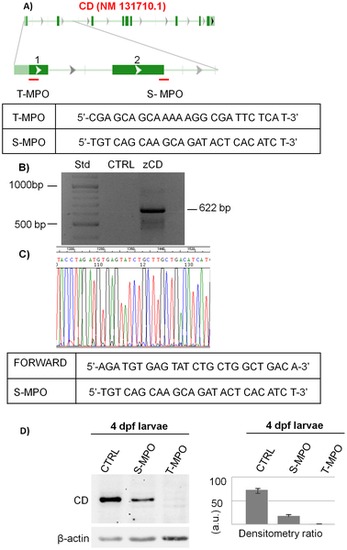
Zebrafish cathepsin D down-regulation by two different morpholinos. A) Schematic representation of S-MPO and T-MPO target regions in the CD RNA. The sequences of both MPOs are shown. B) Cloning of the 622bp, comprehensive of the S-MPO complementary site, from the genomic DNA of 4dpf larvae. C) Portion of the sequence of the 622bp region corresponding to the S-MPO complementary site. This experiment was performed two times with identical results. D) Western blotting of CD in homogenates of 4 dpf larvae deriving from control injection (CTRL), injection with splicing morpholino (S-MPO) and injection with translation morpholino (T-MPO). The filter was incubated with polyclonal antibody against rat CD, stripped and re-probed with monoclonal antibody against β-actin. The densitometry ratio of CD vs actin expression calculated from 5 independent experiments in double is shown. (a.u. = arbitrary units). |
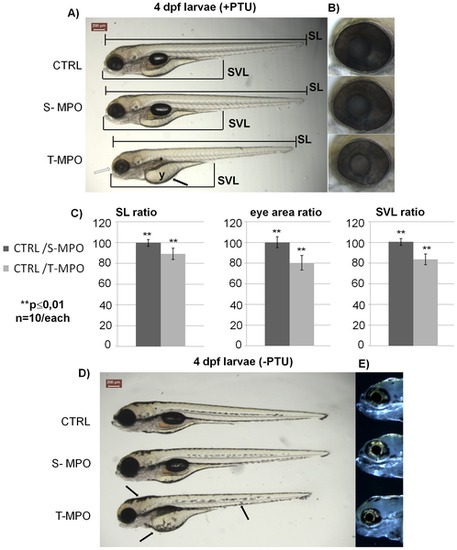
Phenotype of zebrafish cathepsin D following down-regulation by two different morpholinos at 4 dpf. Representative images of 4 dpf larvae resulting from control injection (CTRL), injection with S-MPO or with T-MPO. A) Larvae grown in the presence of PTU (+PTU). The main phenotypic alterations produced by T-MPO CD KD were: 1. microphtalmia (empty arrow); 2. absence of inflated swim-bladder (asterisk); 3. reduced yolk adsorption (arrow); 4. reduced body length (standard length, SL); 5. reduced oro-anal tract length (snout-vent length, SVL). B) Eyes magnification of 4 dpf larvae grown in the presence of PTU; the eye area is enclosed by the dotted circle. C) Body length, oro-anal tract length and eye area ratios calculated between CTRL and S-MPO or CTRL and T-MPO larvae. Measurements were done with the ImageJ software. Ten image sets obtained from 5 different experiments were analysed. Data are given as mean ± S.D. Differences in SL, SVL and eye area data were statistically highly significant (**, p d0,01) according to Student′s t test. D) Larvae grown in the absence of PTU (-PTU). Following T-MPO CD knock-down the larvae showed skin hyper-pigmentation (arrows). E) Eyes magnification of 4 dpf larvae grown in the absence of PTU: dark-field images show normal iridophore reflections. Scale bar in A and D is 200 μm. Data presented in this figure have been reproduced in five independent experiments. PHENOTYPE:
|

Rescue of T-MPO phenotypes by mutated zebrafish CD mRNA. A) T-MPO target sequence and corresponding mutated sequence of the in vitro synthesized CD mRNA. B) Western blotting of CD in homogenates of 2 dpf embryos and 4 dpf larvae deriving from control injection (CTRL), injection with T-MPO alone (T-MPO) and injection with T-MPO plus 200 pg/egg of mutant CD mRNA (RESCUED). The filter was incubated with polyclonal antibody against rat CD, stripped and re-probed with monoclonal antibody against β-actin. The densitometry ratio of CD vs actin expression is shown. (a.u. = arbitrary units). Data reproduced in two to three independent experiments. The empty arrow points to CD expressed by the exogenous mRNA. C) Representative image of 4 dpf larvae obtained from control injection (CTRL), injection with T-MPO alone or with T-MPO plus 200 pg/egg of mutant zebrafish CD mRNA (RESCUED). Larvae body length (SL) and oro-anal tract length (SVL) are indicated. The experiment shows that synthesis of protein CD driven by exogenous CD mRNA in T-MPO injected zebrafish was sufficient to rescue a normal phenotype. Scale bar in C is 200 μm. Data presented in this figure have been reproduced in three independent experiments. |
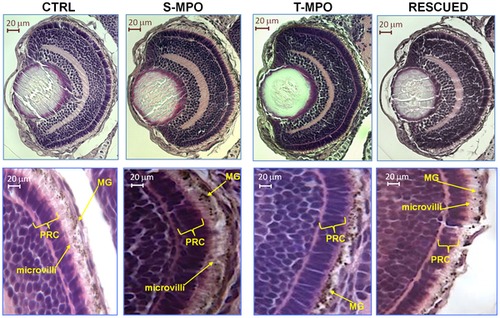
Role of cathepsin D in eye development. Hematoxylin-eosin staining of eye sections derived from 4 dpf micro-injected larvae (CTRL = control injections; S-MPO = splicing morpholino; T-MPO = translation morpholino; RESCUED = translation morpholino plus 200 pg/egg of mutant CD mRNA). Images at high magnification clearly show the palisade of microvilli of RPE cells (which contain melanin granules, MG) that interdigitate in the layer of photoreceptor cells (PRC) in CTRL, S-MPO and RESCUED zebrafish, while this is completely absent in T-MPO CD KD zebrafish (note the RPE cells containing melanine granules close to the PRC layer). Scale bar is 20 μm. Images representative of five (three for Rescued) independent experiments. PHENOTYPE:
|
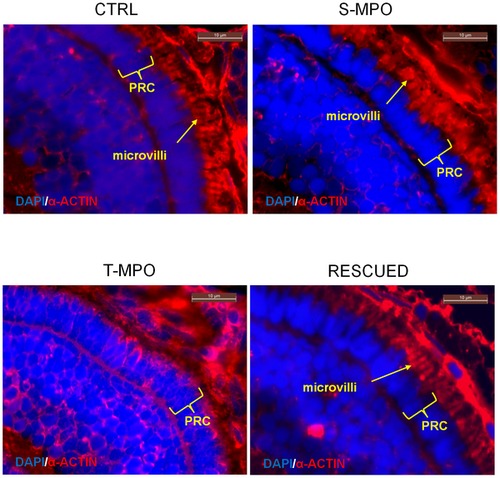
Immunofluorescence staining of microvilli in the eye of zebrafish following cathepsin D knock-down and rescue. Immunofluorescence staining of α-actin (red) in eye sections derived from 4 dpf micro-injected larvae (CTRL = control injections; S-MPO = splicing morpholino; T-MPO = translation morpholino; RESCUED = translation morpholino plus 200 pg/egg of mutant CD mRNA). Nuclei are stained with DAPI (blue). The arrow points to microvilli of RPE cells. Note the absence of this structure in T-MPO zenbrafish. The photoreceptor cell (PRC) layer is indicated by curly brackets. Scale bar is 10 μm. Images representative of five (three for Rescued) independent experiments. PHENOTYPE:
|
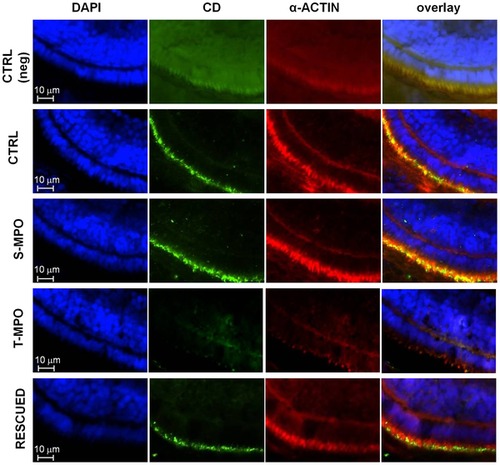
Immunofluorescence staining of CD in microvilli of RPE cells in zebrafish following cathepsin D knock-down and rescue. Immunofluorescence staining of CD and α-actin in eye sections derived from 4 dpf micro-injected larvae (CTRL = control injections; S-MPO = splicing morpholino; T-MPO = translation morpholino; RESCUED = translation morpholino plus 200 pg/egg of mutant CD mRNA). Nuclei are stained with DAPI (blue). As negative control, CTRL larvae sections have been incubated only with secondary antibodies (neg). Note the intense staining for CD in the RPE layer (identifiable by the actin-positive microvilli) in CTRL, S-MPO and RESCUED zebrafish. This experiment confirms the efficient KD of CD by T-MPO in agreement with western blotting data. These images are representative of three independent experiments. Scale bar is 10 μm. |

Unillustrated author statements PHENOTYPE:
|