
- Title
-
Zebrafish krüppel-like factor 4a represses intestinal cell proliferation and promotes differentiation of intestinal cell lineages
- Authors
- Li, I.C., Chan, C.T., Lu, Y.F., Wu, Y.T., Chen, Y.C., Li, G.B., Lin, C.Y., and Hwang, S.P.
- Source
- Full text @ PLoS One

Developmental expression patterns of klf4a and the effect of Notch signaling on klf4a expression. (A) Embryos from different developmental stages were hybridized with either antisense klf4a or sense klf4a RNA probes as indicated. Lateral view is shown for 1 cell, shield, and bud embryos. Dorsal view is shown for 24–96-hpf embryos. B, brain; E, epidermis; EP, exocrine pancreas; I, intestine, L, liver; OB, olfactory bulbs; P, pharynx; PF, pectoral fin; R, retina. (B) Enhanced klf4a expression in intestines (arrow) of DAPT-treated embryos is shown by in situ hybridization and Western blot analyses. Decreased her6 expression in the brain and intestines of DAPT-treated embryos is shown by in situ hybridization. Similar PCNA expression levels are shown in DMSO- and DAPT-treated embryos. (C) Decreased klf4a expression in intestines (arrowhead) of NICD-overexpressed embryos is shown by in situ hybridization and qPCR. Increased her6 expression in the brain and intestines of NICD-overexpressed embryos is shown by in situ hybridization. Error bars indicate the standard error. Student′s t-test was conducted to compare lacZ- and NICD-ectopically expressed embryos. |

Phenotype and histological analysis of klf4a-MO1 and klf4a-MO2-injected morphants and the specificity of klf4a-MOs by Western blot analyses. (A) Western blot analyses demonstrate that co-injection of klf4a-MO1 and klf4a-MO2 (1.5 ng each) prevents the synthesis of klf4a-T7 fusion protein. Similar α-tubulin expression levels are shown in embryos with different treatments. (B) Phenotype comparison among wild type, klf4a-5mmMO2-injected, and klf4a-MO1 and klf4a-MO2-injected embryos at 24 hpf. * indicates the enlargement of midbrain ventricle and the arrow indicates the reduced otic vesicle. (C) Intestinal phenotype comparison among wild type, klf4a-5mmMO1-, klf4a-5mmMO2, and klf4a-MO1 and klf4a-MO2-injected embryos at 96 hpf. The arrow indicates absence of intestinal folding and the arrowhead indicates no inflation of swim bladder. (D) Histological analysis of 96-hpf klf4a-MO1 and klf4a-MO2-injected morphants. I, intestine; L, liver. |

Decreased PepT1 expression is detected in klf4a morphants. PepT1 expression comparison among 80- (A), 102- (B), and 120-hpf (C) klf4a-MO1 and klf4a-MO2-injected morphants, klf4a-5mmMO1-, klf4a-5mmMO2-injected, and wild type embryos. (D) PepT1 expression level analyzed by qPCR. Error bars indicate the standard error. Student′s t-test was conducted to compare klf4a morphants with either wild type, klf4a-5mmMO1- or klf4a-5mmMO2-injected embryos. EXPRESSION / LABELING:
|

Altered goblet cell numbers are detected in klf4a morphants, klf4a-overexpressed, and NICD-overexpressed embryos. Decreased goblet cell number is observed in 102- (A) and 120-hpf (B) klf4a-MO1 and klf4a-MO2-injected morphants as compared with klf4a-5mmMO1-, klf4a-5mmMO2-injected, and wild type embryos by alcian blue staining and goblet cell number quantification. Inlet figure shows a mature and an immature goblet cell. Error bars indicate the standard error. Student′s t-test was conducted to compare both immature and mature goblet cell numbers in klf4a morphants with those in either wild type, klf4a-5mmMO1- or klf4a-5mmMO2-injected embryos. (C) Co-injection klf4a mRNA with klf4a-MO1 and klf4a-MO2 can rescue both mature and immature goblet cell numbers by alcian blue staining and goblet cell number quantification. (D) klf4a overexpression increases goblet cell number by alcian blue staining and goblet cell number quantification. Error bars indicate the standard error. Student′s t-test was conducted to compare both mature and immature goblet cell numbers in klf4a-overexpressed embryos with those of either wild type or lacZ-overexpressed embryos. *p<0.05 exists only for the comparison of immature goblet cell number in klf4a-overexpressed and wild type embryos. (E) Co-injection klf4a and Notch1a NICD mRNAs can rescue both mature and immature goblet cell numbers by alcian blue staining and goblet cell number quantification. PHENOTYPE:
|

Reduction in glucagon-expressing enteroendocrine cell number is detected in klf4a morphants. glucagon RNA probe is used in whole-mount in situ hybridization to detect enteroendocrine cells in 96-hpf (A) wild type, (B) klf4a-5mmMO1- (C) klf4a-5mmMO2-injected, and (D) klf4a-MO1 and klf4a-MO2-injected embryos. (E) Quantification of glucagon-expressing enteroendocrine cell number in 96-hpf embryos with different treatments. Error bars indicate the standard error. Student′s t-test was conducted to compare klf4a morphants with either wild type, klf4a-5mmMO1-, or klf4a-5mmMO2-injected embryos. PHENOTYPE:
|
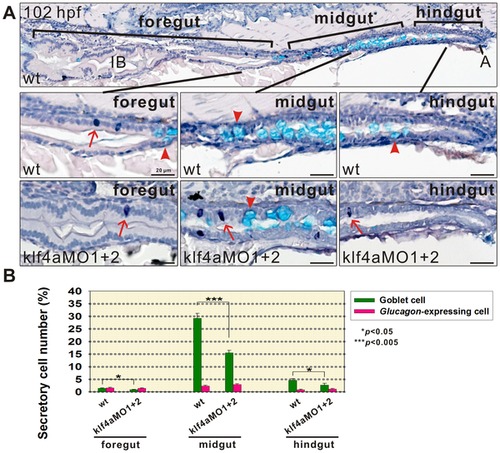
Analysis of secretory cell differentiation along anterior-posterior axis of intestines in klf4a morphants. 102-hpf wild type and klf4a morphant embryos were hybridized with glucagon RNA probe and processed for paraffin embedding and sectioning. Paraffin sections were then used for alcain blue and hematoxylin staining. (A) A section shows complete intestine including intestinal bulb (IB)/foregut, mid-intestine/midgut and posterior intestine/hindgut of a wild type embryo. Corresponding enlarged images of foregut, midgut, and hindgut of both wild type and klf4a-MO1 and klf4a-MO2-injected embryos are shown. Arrows indicate glucagon-expressing enteroendocrine cells and arrowheads indicate alcian blue-stained goblet cells. (B) Comparison of the percentages of goblet cell and glucagon-expressing enteroendocrine cell numbers within different segments of intestines in 102-hpf wild type and klf4a-MO1 and klf4a-MO2-injected embryos. Error bars indicate the standard error. Student′s t-test was conducted to compare klf4a morphants with wild type embryos. A, anus; IB, intestinal bulb. PHENOTYPE:
|
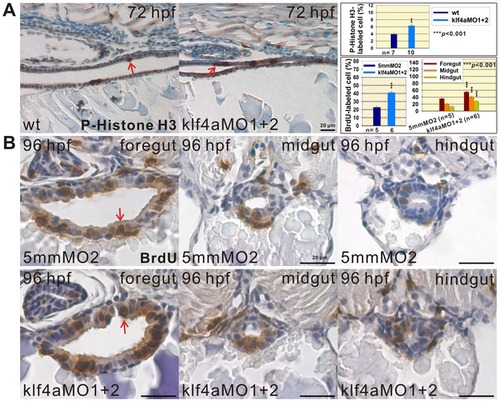
Increased cell proliferation is detected in intestines of klf4a morphants. (A) Images of p-Histone H3-stained cells in intestines of 72-hpf wild type and klf4a-MO1 and klf4a-MO2-injected embryos are shown. Comparison of p-Histone H3-stained cell percentages in intestines of wild type and klf4a morphants is shown. Arrows indicate p-Histone H3-stained cells. Error bars indicate the standard error. Student′s t-test was conducted to compare klf4a morphants with wild type embryos. (B) Images of BrdU-labeled cells in the foregut, midgut, and hindgut of 96-hpf klf4a-5mmMO2-injected and klf4a-MO1 and klf4a-MO2-injected embryos are shown. Comparison of BrdU-labeled cell percentages in intestines and in respective foregut, midgut and hindgut of klf4a-5mmMO2-injected and klf4a morphants are shown in panel A. Arrows indicate BrdU-labeled cells. Error bars indicate the standard error. Student′s t-test was conducted to compare klf4a morphants with klf4a-5mmMO2-injected embryos. PHENOTYPE:
|

Decreased cell proliferation is detected in intestines of klf4a-overexpressed embryos. (A) Images of p-Histone H3-stained cells in intestines of 72-hpf lacZ- and klf4a-overexpressed embryos are shown. Comparison of p-Histone H3-stained cell percentages in intestines of lacZ- and klf4a-overexpressed embryos is shown. Arrows indicate p-Histone H3-stained cells. Error bars indicate the standard error. Student′s t-test was conducted to compare klf4a- with lacZ-overexpressed embryos. (B) Images of BrdU-labeled cells in the foregut, midgut, and hindgut of 72-hpf lacZ- and klf4a-overexpressed embryos are shown. Comparison of BrdU-labeled cell percentages in intestines and in respective foregut, midgut, and hindgut of lacZ- and klf4a-overexpressed embryos are shown in panel A. Arrows indicate BrdU-labeled cells. Error bars indicate the standard error. Student′s t-test was conducted to compare klf4a- with lacZ-overexpressed embryos. |

Transmission electron microscopy shows stratification of intestinal cells and abnormal goblet cell structures in klf4a morphants. Foregut images of a 72-hpf wild type (A) and a klf4a-MO1 and klf4a-MO2-injected (D) embryos are shown. Images of foregut (B) and midgut (C) of 102-hpf wild type and foregut (E) and midgut (F) of klf4a-MO1 and klf4a-MO2-injected embryos are shown. Arrows indicate mature goblet cells and arrowhead indicates an immature goblet cell. |

Developmental expression patterns of klf4a. Lateral view of 48- (A), 72- (B), and 96-hpf (C), and dorsal view of 96-hpf embryos (D), and ventral view of 72- (E) and 96-hpf (F) deyolked embryos are shown. CN, cranial neuron; E, epidermis; EP, exocrine pancreas; HN, habenular neuron; I, intestine; L, liver; OB, olfactory bulbs; P, pharynx; PA, pharyngeal arches; PF, pectoral fin; R, retina. |

Phenotype comparison among 4 ng klf4a-MO1-injected and 16 ng klf4a-MO2-injected morphants and 4 ng klf4a-5mmMO1-injected embryos. (A) Phenotype of 24-hpf embryos with different treatments. * Indicates enlargement of the midbrain ventricles and arrows indicate reduced otic vesicles. (B) Intestinal phenotype of 96-hpf klf4a-MO1-injected and klf4a MO2-injected morphants. Arrows indicate the absence of intestinal folding and arrowheads indicate no inflation of swim bladder. |