
- Title
-
A zebrafish model of Roberts syndrome reveals that Esco2 depletion interferes with development by disrupting the cell cycle
- Authors
- Mönnich, M., Kuriger, Z., Print, C.G., and Horsfield, J.A.
- Source
- Full text @ PLoS One

Late embryonic and larval expression of esco2 in zebrafish. Whole-mount in situ hybridization of zebrafish at the indicated stage with an esco2 antisense riboprobe. A, B, and D are dorsal views, C, E, and F lateral views. Anterior is to the left for all. ov, otic vesicle; epz, eye proliferative zone; pf, pectoral fin; t, tectum; mhb, mid-hindbrain boundary; hpz, hindbrain proliferative zone; ba, branchial arches; p, pharynx; h, heart; g, gut. |

Craniofacial development is abnormal in esco2 morphants. A–D, At 24 hpf, esco2 morphants (B) had a smaller head, smaller eyes and noticeable cell death in the head region compared to wild type (A), and could be partially rescued by depletion of p53 (p53 -/-, C, D). E–H, At 72 hpf esco2 morphants lacked a jaw and showed an abnormal pigmentation pattern (arrows) (F compared with E, wild type). The phenotype was enhanced by depletion of p53 (G, H). A–H, lateral views of live larvae, anterior to the left. I–P, Craniofacial cartilage was stained with Alcian Blue (AB) at 6 dpf. A low dose of esco2 MO was injected to allow for cartilage development (esco2 MO low). Numbers of the pharyngeal arch elements are indicated (2–7). I, J, Ventral views. K, L, lateral views. Pharyngeal arch elements were malformed or missing in esco2 morphants (J, L) compared to wild type (I, K). M, N, closer views of dissected pharyngeal arch elements in wild type (M) and esco2 morphant (N). The arrows point to the kinks in arches 3 and 4. The asterisks mark elongated hypobranchials (hb) in an esco2 morphant. O, closer view of anterior basicranial commissure (abc) in an esco2 morphant, where a gap in the structure was observed (arrowhead). P, closer view of the neurocranium with additional cell structures (arrowhead) at the base of the trabeculae (t) in an esco2 morphant. Q, R, Alizarin Red (AR) staining of bone matrix at 7 dpf (ventral views) revealed that ossification is normal in an esco2 morphant (R, compare to wild type in Q). The close-ups show branchial arch 7. ch, ceratohyal; bh, basihyal; hb, hypobranchial; cb, ceratobranchial; abc, anterior basicranial commissure; t, trabeculae; ep, ethmoid plate. |
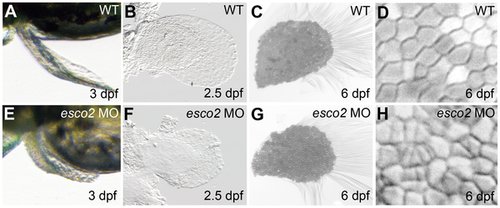
Pectoral fin development is impaired in esco2 morphants. A, B, E, F, The pectoral fin was shorter and abnormally shaped in esco2 morphants. Fins of wild type (A) and morphant (E) live embryos at 3 dpf (dorsal view). Flat-mounted pectoral fins at 2.5 dpf were smaller and less structured in esco2 morphants (F) compared with wild type (B). C, G, D, H, Alcian Blue staining revealed catch-up growth in pectoral fins at 6 dpf. The fins of esco2 morphants (G) were comparable to wild type (C) in size and overall structure. Closer views of cell structure in pectoral fins at 6 dpf showed that cells in esco2 morphant embryos (H) were smaller and more condensed compared to evenly shaped and similar sized cells in wild type (D), perhaps indicating rapid cell divisions in the morphants. PHENOTYPE:
|

Cell cycle is blocked at mitosis in esco2 morphants. A–E, Cells in S phase stained with BrdU were similar in numbers in wild type (A, B) and esco2 morphant (C, D). Statistical analyses did not show a significant difference in cell numbers in the tails of embryos at 2 dpf (E). F–J, pH3 staining of mitotic cells revealed increased cell numbers in esco2 morphant (H, I) compared to wild type (F, G). The difference in cell numbers is statistically significant (J). K–O, Apoptotic cells labeled with TUNEL were severely increased in esco2 morphants (M, N, compared to wild type in K, L). The difference in cell numbers is statistically significant (O). Lateral views of 2 dpf larval heads (A, F, K, C, H, M) and regions in tail above the yolk sac extension (B, G, L, D, I, N), anterior to the left. An asterisk in the graphs (J, O) indicates a statistically significant difference in cell numbers of esco2 morphants compared with wild type embryos (p-value<0.05). P–R, Confocal images of mitotic cells at 1 dpf stained with anti-α-tubulin (red) and counterstained with DAPI (blue, left panels). Right panels: merged images. In esco2 morphants the DNA was fragmented (P, Q, left panels) and spindles were often disorganized (R, right panel) compared to wild type (P). Scale bar: 5 μm. PHENOTYPE:
|

Cell cycle control genes are severely affected in esco2 morphants. A–C, qPCR at 1 and 2 dpf showing significantly increased mRNA abundance in esco2 morphants of p53 (A) and mdm2 (B), and increased mRNA levels of myca (C). D–K, In situ hybridization with a myca probe at 24 hpf and 48 hpf. Note the strong expression in the eyes of esco2 morphants (H) compared with wild type (D) and the abnormal expression in the brain (I compared with wild type in E) at 24 hpf. At 48 hpf myca expression seemed to be slightly increased in the brain of esco2 morphants (J, K compared with wild type in F, G) but was expressed in a normal pattern. D, H, F, J, lateral views, E, I, G, K, dorsal views. Anterior is to the left. |
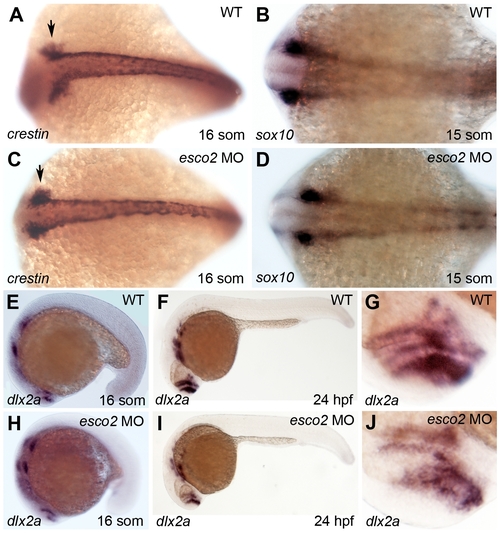
Some neural crest and developmental markers are expressed in a slightly abnormal pattern in esco2 morphants. A, C, Crestin expression at the 16 somite stage. Crestin expressing cells at the anterior side were more condensed in esco2 morphants (C, arrows) than wild type (A). B, D, Sox10 expression was normal in esco2 morphants at the 15 somite stage (D, compared to wild type in B). E–J, Dlx2a expression at 16 somites was normal in esco2 morphants (H, compared to wild type in E). At 24 hpf expression of dlx2a was slightly reduced in the branchial arches and the forebrain of esco2 morphants (I, compared to F). The close-ups on the forebrain show an abnormal dlx2a distribution in esco2 morphants (J, compared to wild type in G). EXPRESSION / LABELING:
|
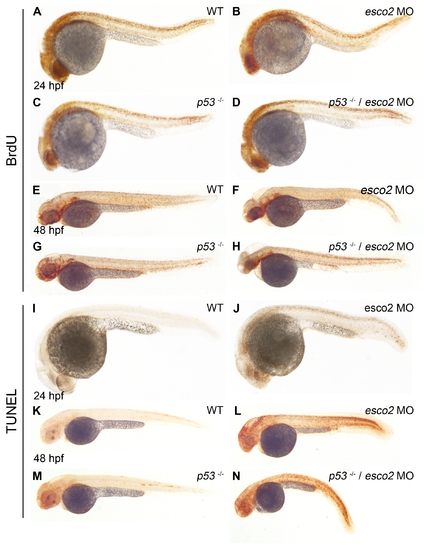
Apoptosis in esco2 morphants is independent of p53. A–H, BrdU-labeled proliferating cells at 24 hpf (A–D) and 48 hpf (E–H). Proliferation was normal in esco2 morphants (B, F, compare to wild type in A, E). Additional depletion of p53 in the p53M214K mutant line (p53 -/-, C, G) led to increased proliferation at 48 hpf (H), but not 24 hpf (D). I–N, TUNEL staining of apoptotic cells at 24 hpf (I, J) and 48 hpf (K–N). Apoptosis was severely increased in esco2 morphants (J, L, compared to wild type in I, K), and independent of additional depletion of p53 (M, N). |

Runx1 expression is normal in esco2 morphants. Runx1 expression at 12–13 somites was normal in esco2 morphants (B, compared to wild type in A) compared to missing expression in hematopoietic progenitor cells in rad21nz171 mutants (C, [36]). EXPRESSION / LABELING:
|