
- Title
-
Fate restriction in the growing and regenerating zebrafish fin
- Authors
- Tu, S., and Johnson, S.L.
- Source
- Full text @ Dev. Cell
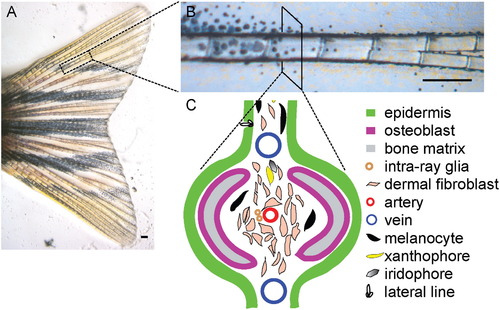
The Anatomy and Different Cell Types of the Zebrafish Caudal Fin (A–C) The zebrafish adult caudal fin is almost transparent, except that it has some pigmented cells: the melanocytes (black cells), xanthophores (yellow cells), and iridophores (shiny cells) (A). The caudal fin is supported by 18 bony fin rays (B). Cross section of a single fin ray identifies at least ten different cell types. The organization of the different cell types in the fin ray is illustrated in (C). Scale bars, 0.2 mm. |

Clonal Analysis Identifies Nine Distinct Lineage Classes in the Zebrafish Fin (A) A Tol2 transposon lineage marker was injected into one or two cell embryos as previously described (Tu and Johnson, 2010). A highly mosaic embryo is indicative of transposon integration. (B) An example of caudal fin (dorsal half) with mosaic GFP expression. This fin has three types of labelings: three patches of labeled epidermis (dotted line), labeled osteoblasts in three fin rays (arrows), and a string of labeled lateral line neuromasts (arrowhead). Single asterisk indicates reflection from white cells (Johnson et al., 1995) at the tip of the dorsal lobe. Double asterisks indicate labeled scale (not part of the fin) on the tail of the fish. (C) Analysis of co-occurrence of GFP-labeled cell types. The first column lists the different cell types in the fin, with the number of fins carrying the labeled cell type in the data set of 116 mosaic caudal fins. Numbers shown in matrix cells indicate the co-occurrence of each cell type as percentage of total number of fins with labeled cell type in the first column. For example, within the 71 fins carrying labeled epidermis, 7.0% of them also carried labeled melanocytes, which is the observed co-occurrence between the two cell types. Comparing that to the expected co-occurrence (predicted by multiplying the percentage of each cell type) by using a chi-square test yields a p value indicating that the difference is not statistically significant (denoted by light-blue shading); thus, the epidermis and melanocytes are not significantly associated and most likely arise from different FSCs. The same chi-square test was carried out for all pairwise combinations of any two cell types in the fin. p values were calculated to determine whether the associations were significant. Light blue indicates nonsignificant association, whereas yellow shows significant association. The multiple testing-adjusted threshold for 95% significance is p = 0.0009. (D) Labeled intraray glia clone. Arrow points to the intraray nerve with labeled glia. Asterisk indicates strong autofluorescence from the xanthophores. Thin gray line outlines the fin ray and the joints. (E–G) Labeled lateral line clone (E). Arrow points to a GFP+ neuromast, and arrowhead points to GFP+ interneuromast glia. Notice lateral line resides in the space between fin rays. Osteoblast clone (F) looks like a sheet of cells covering the mineralized bone matrix. Dermal fibroblast clone (G) appears more punctate, and encased between the hemirays, and GFP signal is excluded from where the artery lies. Notice that labeled osteoblast clone and dermal fibroblast clone have clearly different appearances in high magnification (F′ and G′). (H) Vascular clone containing both artery (arrowhead) and vein (arrows). (I) Labeled epidermis (skin) clone (outlined by dotted line). Note that this epidermis clone has both proximal and distal boundaries. Asterisk indicates reflection from white cells. (J) Labeled resident blood cells (arrowhead). (K) Neutral red (macrophage marker) staining of resident blood clone ([Ellett et al., 2010] and [Winckler, 1974]). Green indicates GFP from live fish. Red shows neutral red staining. Scale bars, 0.2 mm. See also Figure S1. |

Lineages Do Not Transfate in the Regenerating Zebrafish Fin (A) Labeled melanocyte/xanthophore clone, shown at 20 days postamputation (dpa), only regenerated melanocytes and xanthophores. Arrows and arrowheads point out the labeled melanocytes and xanthophores proximal (left) and distal (right) to the amputation plane (dashed line), respectively. The empty white arrow points to an unlabeled melanocyte, whereas the empty yellow arrowhead points to an unlabeled xanthophore. A GFP-labeled melanocyte appears as a black circle surrounded by a green halo (A′), whereas a GFP-labeled xanthophore appears as a yellow circle surrounded by a green halo (A′′). Light-gray line outlines the fin ray. (B) Intraray glia clone (arrows) only regenerates label in the intraray nerve. Asterisk denotes autofluorescence from xanthophores. (C) A lateral line clone regeneration at 20 dpa. Arrows and arrowheads point to the lateral line neuromasts and glia proximal (left) and distal (right) to the amputation plane, respectively. (D) Epidermis (skin) clone only regenerated epidermis. (E–J) Confocal images (sagittal view) of a regenerating osteoblast clone (E–G), and a dermal fibroblast clone (H–J) at three positions: proximal to amputation plane (E and H), at the amputation plane (F and I), and distal to the amputation plane (G and J). Note that both clones are mosaic in the fin ray, with the osteoblast clone forming a continuous sheet immediately adjacent to medial and lateral surfaces of the bone matrix, in this case labeling the dorsal (top) of the ray, whereas the dermal fibroblast clone labels a population of loose mesenchymal cells in the interior of the fin ray. Dermal fibroblast clones are typically intermixed with unlabeled dermal fibroblasts throughout the intraray space. Red shows alizarin red staining of the bone matrix. Asterisk denotes autofluorescence from xanthophores. (K) Whole-mount stereoscope view of regenerating vasculature clone; note that only vasculature carries label in the regenerate. Green shows GFP from labeled clone in live fish. Dashed lines indicate amputation plane. Scale bars, 0.2 mm. See also Figure S1. |
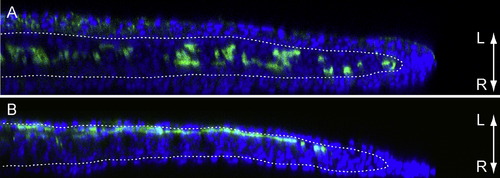
Confocal Microscopy Shows Spatial Restriction of Dermal Fibroblasts and Osteoblast in the Regeneration Blastema (A) Dermal fibroblast clone in 4 days postamputation (dpa) regeneration blastema. (B) Osteoblast clone in 4 dpa regeneration blastema. Dotted line outlines the basement membrane. Blue shows DAPI stain and green illustrates GFP (immunohistochemistry). L and R denote left and right sides of fish, respectively. |
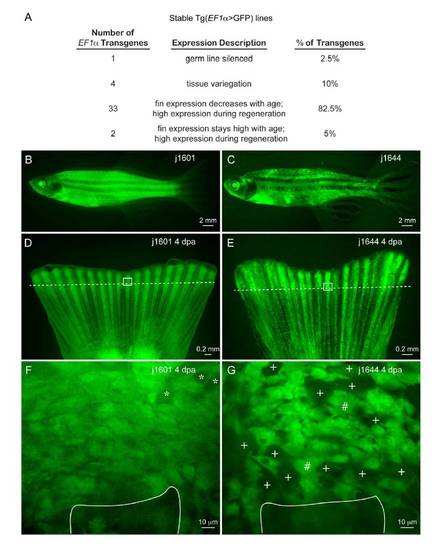
Stable transgenic EF1α>GFP lines express GFP ubiquitously in the caudal fin. (A) Summary of 40 EF1α>GFP stable lines generated using Tol2 EF1α>GFP lineage marking transposon. Almost 90% of the stable transgenic lines have uniform expression in the adult caudal fin, while 10% of the lines exhibit variegating GFP expression. Examples of GFP expression in adults in a uniform expressing line (B, D, F) and in a line that shows tissue variegation (C, E, G). Following amputation, GFP expression is typically up-regulated in all cells of the regenerate in both uniform lines (D) and variegating lines (E), similar to a previously reported stable EF1α>GFP transgenic line (Thummel et al., 2006). (F,G) Representative confocal, sagittal Z-sections through 4 dpa proximal regenerates in the uniform expression line and the variegating expression line corresponding to areas outlined by white boxes in whole mounts (D, E) shown above. Asterisks indicate vascular lumen and white lines outline the positions of fin rays in each stump, with top of line indicating the amputation plane. In the uniform expression line, every cell expresses GFP, which tends to rule out the possibility that clonal analysis missed a role for transdifferentiation due to transdifferentiation-dependent EF1α>GFP transgene silencing. In the variegating fin regenerate (H), we observed the majority of cells showed strong GFP expression (#) while a minority of cells showed dimmer GFP expression (+), at levels that would likely be detected in clonal analysis. EF1α>GFP stable transgenic lines are available from the Zebrafish International Resource Center. |
Reprinted from Developmental Cell, 20(5), Tu, S., and Johnson, S.L., Fate restriction in the growing and regenerating zebrafish fin, 725-732, Copyright (2011) with permission from Elsevier. Full text @ Dev. Cell