
- Title
-
Zebrafish Prickle1b mediates facial branchiomotor neuron migration via a farnesylation-dependent nuclear activity
- Authors
- Mapp, O.M., Walsh, G.S., Moens, C.B., Tada, M., and Prince, V.E.
- Source
- Full text @ Development
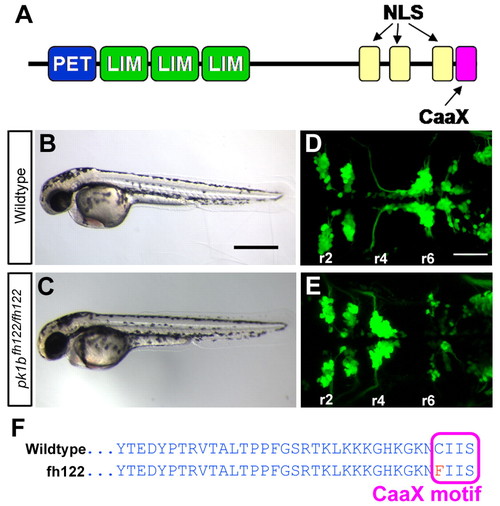
prickle1b is disrupted in zebrafish fh122 mutants. (A) The domain structure of Pk1b. NLS, nuclear localization signal. (B,C) Lateral brightfield views of 48 hpf wild-type (WT) (A) and pk1bfh122/fh122 (B) embryos. pk1bfh122/fh122 embryos are morphologically normal. Anterior is to the left. (D,E) Maximum projection dorsal views of cranial branchiomotor neurons (CBMNs) in 48 hpf Tg(islet1:GFP) embryos. Rhombomeres are indicated (r2-r6). In WT embryos (C), facial branchiomotor neuron (FBMN) cell bodies migrate from r4 to r6. In fh122 mutants (D), FBMNs fail to undergo caudal tangential migration and cell bodies cluster in r4. (F) Amino acid sequence of Pk1b in WT and pk1bfh122/fh122 fish. The fh122 mutation results in a C-to-F transition in the Pk1b farnesylation (CaaX) motif. Scale bars: 500 μm in B; 50 μm in D. |

Hmgcrb and Fntb are required for FBMN migration. (A) Summary of the Hmgcrb biosynthetic pathway, including enzymes (green) and disrupting agents used in this study (red). Hmgcrb catalyzes the first rate-limiting step in the generation of farnesylated and geranylgeranylated proteins, as well as in the synthesis of cholesterol. (B-H) Maximum projection dorsal views of FBMNs (green) in 42 hpf Tg(islet1:GFP) zebrafish embryos, immunostained for EphA4 to mark r5 (red). FBMNs migrate to r6 in control embryos (B), whereas migration is completely blocked in Pk1b morphants (C). Disruption of Hmgcrb function in hmgcrb mutants (D), by injection of Hmgcrb MO (E) or by treatment with atorvastatin (F), partially blocks migration. Migration is also partially blocked in embryos injected with Fntβ MO (G) or with the Fnt inhibitor L-744 (H). Scale bar: 20 μm. (I) Extent of FBMN migration following the treatments indicated. The number of embryos scored is indicated in parentheses. |
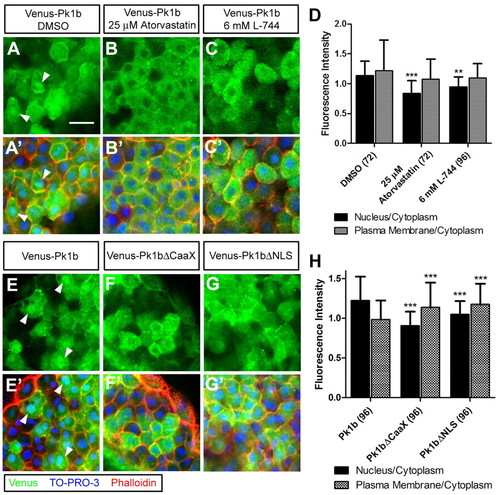
Nuclear localization of Venus-Pk1b is mediated by farnesylation and NLS motifs. (A-C′) Single confocal sections of zebrafish blastulae expressing Venus-Pk1b (green) treated with DMSO (A,A′, control), atorvastatin (B,B2) or L-744 (C,C′), with nuclei labeled by TO-PRO-3 (A′-C′, blue) and plasma membrane labeled by Rhodamine phalloidin (A′-C′, red). Arrowheads highlight cells with elevated nuclear localization. (D) Ratio of fluorescence intensity in nuclei versus cytoplasm (black bars) and plasma membrane versus cytoplasm (gray bars) for the treatments indicated. The number of cells scored is indicated in parentheses. (E-G′) Blastulae expressing Venus-Pk1b (E), Venus-Pk1bΔCaaX (F) or Venus-Pk1bΔNLS (G) (green), with nuclei (E′-G′, blue) and plasma membrane (E2-G2, red) labeled. Arrowheads highlight cells with elevated nuclear localization. (H) Ratio of fluorescence intensity in nuclei versus cytoplasm and plasma membrane versus cytoplasm for the constructs indicated. **, P<0.01; ***, P<0.001; one-way ANOVA. Error bars indicate s.d. Scale bar: 20 μm. |

Nuclear localization of Pk1b is required during FBMN migration. (A) The rescue construct. (B-J′′) Maximum projection dorsal views of FBMNs (red) in 48 hpf Tg(zCREST1:membRFP) zebrafish embryos. (B,C) FBMNs migrate to r6 in uninjected embryos (B), whereas migration is completely blocked in Pk1b morphants (C). (D-J) Representative embryos injected with Pk1bMO and/or Venus-tagged rescue constructs (green). CBMN-specific expression of full-length Venus-Pk1b can partially rescue FBMN migration to varying extents; embryos with higher transgenesis efficiency (D) generally display greater rescue capacity than those with lower efficiency (E). Expression of Venus-Pk1bΔCaaX (F), Venus-Pk1bΔNLS (G) or myr/palmVenus-Pk1bΔNLS (H) significantly reduces rescue capacity. Neither Venus-Pk1b (I) nor myr/palmVenus-Pk1bΔNLS (J) expression significantly disrupts migration in the absence of Pk1bMO. (F′-J′′) Magnified, single-slice views of boxed regions of F-J, showing nuclear exclusion of Venus in a subset of neurons (arrowheads). (K-L′) Dorsal views of CBMNs (red) in representative 48 hpf Tg(zCREST1:membRFP) embryos uninjected (B) and injected with Venus-Pk1b (green). Rhombomeres are indicated. (L′) Magnified view of boxed region in L. Arrowheads highlight TgBMNs migrating out of r2 into r3 and r4. (M,N) Venus-positive neurons were scored for their anteroposterior position. The percentage of neurons in r4-6 is shown. The number of neurons scored is indicated in parentheses. ***, P<0.001; **, P<0.01; χ2 test (relative to MO + Venus-Pk1b). (O) Embryos that displayed at least one Venus-positive TgBMN were scored. The percentage of embryos with at least one Venus-positive migratory TgBMN is displayed. The number of embryos scored is indicated in parentheses. Scale bars: 20 μm. |

REST function is required for FBMN migration. (A-C) Maximum projection dorsal views of FBMNs (green) in 42 hpf Tg(islet1:GFP) zebrafish embryos, immunostained for EphA4 to mark r5 (red). FBMN migration is partially disrupted in REST morphants (B) and in mCherry-zhREST4-injected embryos (C), relative to controls (A). Scale bar: 20 μm. (D) The extent of FBMN migration was scored in embryos with disrupted REST function. The number of embryos scored is indicated in parentheses. |

REST is localized to the nuclei of migrating FBMNs. (A-D′,I-L′) Single-slice dorsal views of FBMNs (red) in Tg(zCREST1:membRFP) zebrafish embryos immunostained for REST (green) at the indicated stages. (A-D) In WT neurons, REST localized throughout the cell body during migration (A,B). As neurons settle in r6, REST becomes depleted from the nuclei (C). By 48 hpf, REST protein is further reduced or absent in FBMN cell bodies (D). (I-L) In Pk1b morphants, REST is depleted from the nuclei of FBMNs and expression is maintained at later embryonic stages. Arrowheads highlight individual FBMNs and arrows indicate non-FBMNs. A′-D′ and I′-L′ show REST immunostaining alone Scale bars: 10 μm. (E-H,M-P) Schematics illustrating REST localization (green) in FBMNs (red); nuclei are indicated (blue). See also Fig. S6 in the supplementary material. (Q-T) Localization of REST was scored in WT and Pk1bMO FBMNs. Percentage of FBMNs with depleted nuclear REST or localization throughout the cell body is displayed. The number of neurons scored is indicated in parentheses. EXPRESSION / LABELING:
PHENOTYPE:
|

Interaction with Pk1b is required for proper REST localization during FBMN migration. (A,A′) Zebrafish blastulae expressing Venus-Pk1b-R125Q (green), with nuclei (A′, blue) and plasma membrane (A′, red) labeled. (B) Ratio of fluorescence intensity in nuclei versus cytoplasm (black bars) and plasma membrane versus cytoplasm (gray bars). Number of cells scored is indicated in parentheses. Error bars indicate s.d. (C) Dorsal view of FBMNs (red) in representative 30 hpf Tg(zCREST1:membRFP) embryo injected with Pk1bMO and Venus-Pk1b-R125Q (green). (D) Venus-positive neurons were scored for their anteroposterior position and totaled. The percentage of neurons in r4-6 is shown. Numbers in parentheses indicate number of neurons scored. ***, P<0.001; χ2 test. (E) Percentage of embryos with migratory TgBMNs was scored. The number of embryos scored is indicated in parentheses. (F-H′) Dorsal views of FBMNs (red) in r4 of representative 30 hpf Tg(zCREST1:membRFP) embryos injected with Pk1bMO and Venus-Pk1b (E), Venus-Pk1bΔCaaX (F) or Venus-Pk1b-R125Q (G) (green). Embryos were immunostained for REST (blue). (E) REST is correctly localized in nuclei of Venus-Pk1b-positive neurons (arrowheads). (F,G) REST is depleted from nuclei of FBMNs expressing Venus-Pk1bΔCaaX or Venus-Pk1b-R125Q.F′-H′ show REST immunostaining alone (I) Venus-positive neurons in r4 were scored for localization of REST and totaled. The percentage of neurons is shown. The number of neurons scored is indicated in parentheses. Scale bars: 20 μm in A,C; 10 μm in F. |

Pggt1b and Sqle activities are required for FBMN migration. (A-E) Lateral brightfield views of 48 hpf embryos, anterior to the left. Embryos were treated with DMSO (A), 75 μM terbinafine (Lamisil) beginning at 0.2 hpf (B,C), or 200 μM terbinafine beginning at 16 hpf (D,E). Inhibition of Sqle activity with terbinafine treatment results in several morphological defects, including shortened axis, thickened yolk extension and pericardial edema. Scale bar: 500 µm. (F-H) Dorsal views of FBMNs (green) in 42 hpf Tg(islet1:GFP) embryos, immunostained for EphA4 to mark r5 (red). FBMN migration is partially disrupted in Pggt1β morphants (F) and in embryos injected with 3 mM GGTI-2147 (G) or treated with 200 μM terbinafine (H). There is also an aberrant accumulation of GFP-positive neurons at the midline in r6-r7 of Pggt1β-injected embryos (arrowhead). Scale bar: 20 μm. (I) Extent of FBMN migration was scored in embryos with disrupted Pggt1β and Sqle activities. Number of embryos scored is indicated in parentheses. |
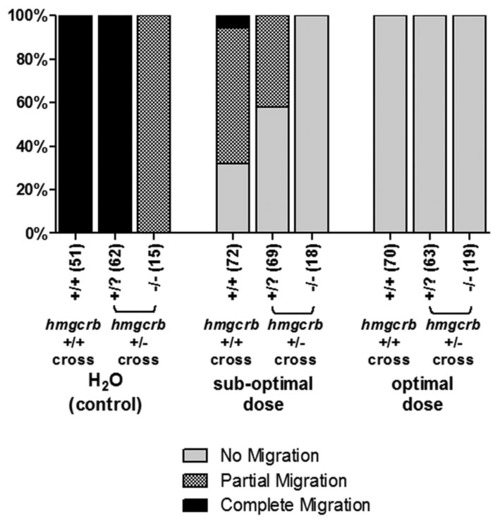
pk1b and hmgcrb genetically interact. Embryos from hmgcrb+/- ; Tg(islet1:GFP) crosses were injected with either H2O (control), suboptimal or optimal doses of Pk1bMO. Injected embryos were fixed at 48 hpf, immunostained for EphA4, and scored for the extent of FBMN migration, as well as for hmgcrb convergent-extension phenotype. Wild-type siblings were used as controls. Injection of a suboptimal dose of MO increases the proportion of hmgcrb+/? embryos with partial and no migration phenotypes. PHENOTYPE:
|

Immunohistochemistry reveals localization of endogenous REST protein. (A-D) Dorsal views of 24 hpf (A,B) and 48 hpf (C,D) Tg(zCREST1:membRFP) embryos. Uninjected (A,C) and REST morphant (B,D) embryos were immunostained for REST (green). FBMNs are visible in A and B (red). REST expression is elevated in several subsets of cells, including reticulospinal neurons (C). Full-length REST protein levels are substantially reduced in REST morphants. E) Dorsal view of the hindbrain in a 24 hpf embryo immunostained for REST. Arrow highlights elevated REST expression in the floor plate. (F-F′′,H-H′′) Single-slice dorsal views of FBMNs (red) in 24 hpf uninjected (F-F′′) and Pk1b morphant (H-H′′) Tg(zCREST1:membRFP) embryos immunostained for REST (green), with nuclei labeled by TO-PRO-3 (blue). (G,I) REST localizes throughout the cell body of wild-type FBMNs, including in the nuclei (G). In Pk1b morphants, REST is reduced in the nuclei and enriched in the cytoplasm (I). |