
- Title
-
Embryonic senescence and laminopathies in a progeroid zebrafish model
- Authors
- Koshimizu, E., Imamura, S., Qi, J., Toure, J., Valdez, D.M., Carr, C.E., Hanai, J., and Kishi, S.
- Source
- Full text @ PLoS One
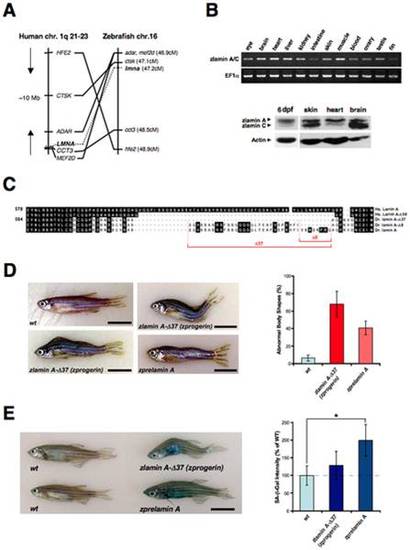
Transgenic expression of zebrafish Progerin/lamin A-Δ37 and prelamin A. (A) The zebrafish LMNA gene was assigned to Linkage Group 16 (LG16) and is syntenic with human chromosome 1q21-23. Left: six genes including LMNA are located within a 10 Mb genomic region on human chromosome 1. Right: six zebrafish homologs of these genes are listed according to the map positions on LG16. (B) RT-PCR analysis of adult zlamin A revealing strong expression in the brain, heart, liver and muscle (upper panels). Western analysis of 6 dpf embryo lysates and 1-year old adult tissues was preformed using an anti-chicken lamin A polyclonal antibody (ab14309), as well as an anti-mouse actin monoclonal antibody as a loading control (lower panels). (C) Amino acid sequence alignment of the C-terminal portions in human (Homo sapiens) lamin A (Hs. lamin A) and zebrafish (Danio rerio) lamin A (Dr. lamin A) and their deleted forms (Δ50 in human; Δ37 and Δ8 in zebrafish) induced by cryptic splicing events. (D) External features of a wild-type non-transgenic sibling fish (wt; 1.5-year old). Two representative zprogerin transgenic fish with curved trunks (zlamin A-Δ37; 1.5-year old) are shown. A zprelamin A transgenic fish with a wavy trunk (2.1-year old) is also shown. In these transgenic fish, spinal curvatures and disproportional body shapes are prominently observed. Scale bars, 1 cm. Qualifications of the abnormal body shapes are shown in the right graph (cohorts of 18 months of age). (E) SA-β-gal staining of wild-type sibling and transgenic fish (1.9-year old). Quantifications of the SA-β-gal intensities in the fish are shown in the right graph (cohorts of 18 months of age, *P<0.01). |

Knockdown of zebrafish lamin A/C. (A) Western blot analysis of intrinsic lamin A/C in the zebrafish AB9 cells transfected with MOs. The lower panel of blotting shows the actin control (*P<0.01). The right-side graph shows the quantitation results for the lamin A and C blot intensities standardized by the control actin levels from three-independent experiments. (B) Agarose gel electrophoresis of the RT-PCR products of zlamin A from embryos injected with the indicated concentrations of zLMNA-MO2. The primers used recognize exon 9 (forward primer; F-Primer) and the 3′-untranslated region (reverse primer; R-Primer). Sequence analysis revealed that the injection of zLMNA-MO2 induces a 24 bp deletion in the rear part of exon 11. Left panel, total RNA was extracted from 24 hpf embryos after MO injection. Right panel, embryos were injected with 8 ng MO and total RNA was extracted from 24 to 72 hpf as indicated. Lower panel, the corresponding positions of the F-Primer, R-Primer, and MO2 are schematically presented. (C) Gross morphology of zlamin A/C-knockdown embryos. Lateral views of MO-injected embryos (4 ng) at 24 hpf are shown. (a) 5-base mismatch control MO1 (MO1, 5-mis), (b) zLMNA-MO1 (MO1, MO), (c) 5-base mismatch control MO2 (MO2, 5-mis), (d) zLMNA-MO2 (MO2, MO). (D) Occasionally observed rough skin phenotypes (Mild and Severe) in MO2-morphant tails are shown by comparison with a normal skin phenotype (Normal) in the wild-type tail. EXPRESSION / LABELING:
PHENOTYPE:
|
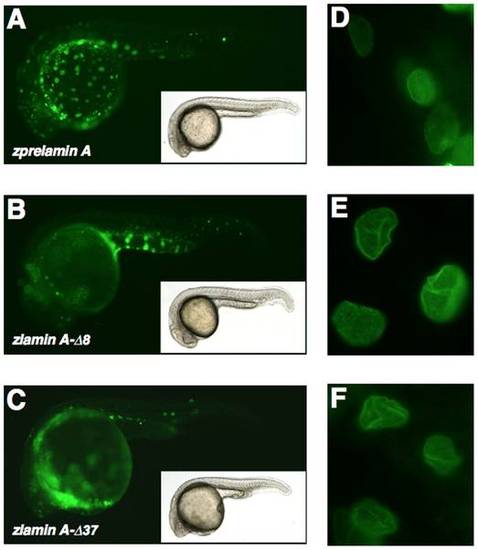
Expression of EGFP-tagged zprelamin A, zlamin A-Δ8, and zlamin A-Δ37/zProgerin in zebrafish embryos and the nuclear morphologies in the expressing cells (A) EGFP-zPrelamin A expression in zebrafish embryos. (B) EGFP-zlamin A-Δ8 expression in zebrafish embryos. (C) EGFP-zlamin A-Δ37/zProgerin expression in embryos. (D) The nuclear localization of EGFP-zPrelamin A and the nuclear morphology in the expressing cells within the embryo. (E) The nuclear localization of EGFP-zlamin A-Δ8 and the nuclear morphology in the expressing cells within the embryo. (F) The nuclear localization of EGFP-zlamin A-Δ37/zProgerin and nuclear morphology in the expressing cells within the embryo. |

The knockdown of zebrafish lamin A/C induces laminopathies associated with muscular dystrophy and craniofacial abnormalities. (A) Muscle fiber visualization in zlamin A/C-knockdown embryos. (a–d) The left panels show a lateral view of the entire embryo bodies and a magnified bright field view of the somites. (e–h) Lateral views of MO-injected embryos at 24 hpf stained with the F59 antibody (adaxial cells/slow muscle fibers). In panel (f), white arrowheads indicate broken or missing muscle fibers. In panel (h), white arrowheads indicate the wavy muscle fibers in compared with control embryos. (i–l) The right panels show cryostat sections of 48 hpf LMNA-MO injected embryos stained for fast muscle fibers (F310). (B) Percentage of muscle phenotypes scored for MO-injected embryos at 24 hpf. The graph shows the distribution of phenotypes observed following injections with 4 ng of MOs. Migration failure in embryos is represented in gray and wavy muscle fibers in black. The percentage of each muscle phenotypes ‘waving’, ‘migration failure’, ‘normal’ were, respectively, MO1-5mis; 7.5%, 5.0%, 87.5%; MO1-MO; 3.8%, 46.2%, 50.0%; MO2-5mis; 6.1%, 6.1%, 87.8%; MO2-MO; 29.4%, 25.5%, 45.1%. (C) Cartilage in 6 dpf larvae were stained with Alcian blue and then whole-mounted. (a–d) Lateral views of the head portions of living larvae are shown in the top panels. (e–h) Lateral view of Alcian blue stained larvae. (i–l) Ventral views of Alcian blue stained larvae. The red lines indicate the ceratohyal articulates (ch), and the red arrow indicates the Meckel′s (m) to palatoquadrate (pq). |
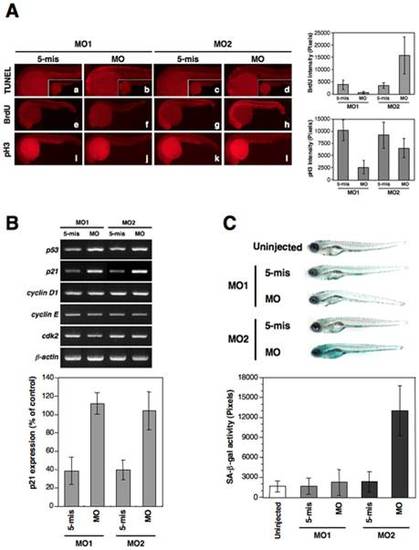
The knockdown of zebrafish lamin A/C induces an aberrant cell cycle, apoptosis, and senescence. (A) Apoptosis and cell cycle analysis in 24 hpf embryos. (a–d) Lateral view of apoptotic phenotypes in MO-injected embryos using a TUNEL assay (TUNEL-positive cells are indicated by the red fluorescence spots). zLMNA-MO1-injected embryos shows increased apoptosis in the head and trunk. (e–h) BrdU incorporation in MO-injected embryos. zLMNA-MO2-injected embryos show increased BrdU-positive cells throughout the whole body. (i–l) MO-injected embryos stained with anti-phospho histone H3 (pH 3). A zLMNA-MO1-injected embryo shows a decreased number of pH 3-positive cells. Quantifications of the BrdU and pH 3 intensities in morphants are shown in right graphs (BrdU: MO1, P<0.05 for 5-mis versus MO, MO2, P<0.05 for 5-mis versus MO; pH 3: MO1, P<0.05 for 5-mis versus MO, MO2, no significance for 5-mis versus MO). (B) Genes involved in the p53-related and cdk2 pathways were analyzed by semi-quantitative RT-PCR in MO-injected embryos at 24 hpf. Quantifications of the bands intensities for p21 are shown in the bottom graph (P<0.01 for 5-mis versus MO in MO1 and MO2). (C) SA-β-gal assay of 6 dpf MO-injected larvae in comparison with each control 5-mis MO. Qualifications of the SA-β-gal activity are shown in bottom graph. The zLMNA-MO2-injected embryos revealed strong induction of SA-β-gal activity (P<0.01 for 5-mis versus MO in MO2), whereas the zLMNA-MO1-injected embryos did not exhibit any obvious activity, compared with Cont-MO1-injected embryos. |

A lipodystrophic phenotype is caused by the zebrafish lamin A/C knockdown. Lateral view of 5 dpf larvae stained with Oil Red O. Strong staining can be observed around the head, the otic vesicle, the jaw, the swim bladder and the heart, as well as in the yolk of the Cont-MO-injected larvae. In contrast, in zLMNA-MOs-injected embryos, obvious defects in lipid deposits can be observed in all the tissues except the swim bladder. Duplicate samples are shown for each MO-injected specimen. |
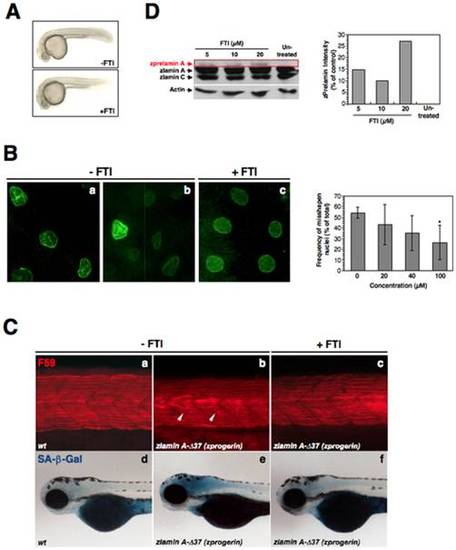
FTI treatment of zprogerin/zlamin A-Δ37 transgenic zebrafish. (A) External features of zprogerin transgenic zebrafish (30 hpf) without (Control, -FTI) or with FTI treatment (100 μM, +FTI). (B) Amelioration of nuclear morphology by FTI treatment (100 μM, +FTI) in comparison with untreated (-FTI) zprogerin fish. Analysis of the misshapen nuclear morphology was also performed by using different concentrations of FTI in zprogerin transgenic embryos at 30 hpf as shown in right graph. The number of cells with abnormally shaped nuclei were determined by fluorescence microscopy (*P<0.05). (C) Amelioration of muscle phenotype (stained with the F59 antibody) at 24 hpf and reduction of SA-β-gal activity at 3.5 dpf in zprogerin fish embryos by FTI treatment (100 μM, +FTI) in comparison with the untreated condition (-FTI). (D) Western blot analysis of prelamin A accumulations in AB9 zebrafish fibroblasts following FTI treatment, and the quantitation of prelamin A amounts in right graph. The quantifications of intrinsic prelamin A accumulations were shown are the averages from two-independent experiments. PHENOTYPE:
|
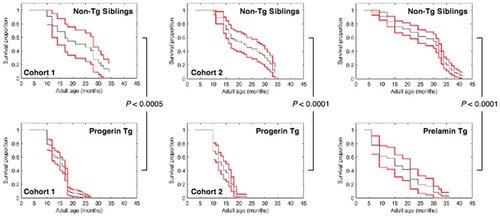
Demographic analysis of the lifespan in zprogerin and zprelamin A transgenic zebrafish. A shorter lifespan in z PHENOTYPE:
|

Expression of zebrafish lamin A/C in adult fish. Immunofluorescence microscopy of 1-year old adult zebrafish fin cells in situ. The immunostaining reveals that zebrafish lamin A/C is localized to the nuclear envelope. EXPRESSION / LABELING:
|

Expression of zebrafish lamin A/C during early development. (A) RT-PCR analysis of zlamin A/C, zlamin A and zlamin C during early development. (B) Expression patterns of zlamin A/C during early development (0.75 to 72 hpf) (a–e, g, i, k, and n are lateral views; f, h, j, m, and p are dorsal views; l, and o are ventral views. pf: pectoral fin; op: opercle). EXPRESSION / LABELING:
|

MO-injected embryos stained with anti-PCNA. Lateral views of MO-injected embryos at 24 hpf stained with the PCNA antibody. EXPRESSION / LABELING:
|
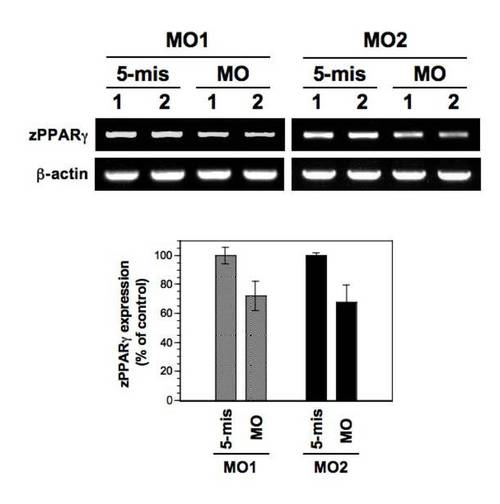
PPARγ mRNA expression in lamin A/C morphants. The expression of zebrafish PPARγ in the morphants was semi-quantitatively analyzed by single-embryo RT-PCR at 72 hpf. Two independent samples (lanes 1 and 2) for MO1 (both 5-mis and MO) and MO2 (both 5-mis and MO) were loaded in the lanes (upper picture panels). In quantitation (lower graph panel), the expression levels of PPARγ mRNA were significantly decreased in zLMNA-MO-injected (MO) embryos in comparison with the controls (5-mis) (P<0.01 for 5-mis versus MO in MO1 and MO2). EXPRESSION / LABELING:
PHENOTYPE:
|