
- Title
-
Assembly and patterning of the vascular network of the vertebrate hindbrain
- Authors
- Fujita, M., Cha, Y.R., Pham, V.N., Sakurai, A., Roman, B.L., Gutkind, J.S., and Weinstein, B.M.
- Source
- Full text @ Development
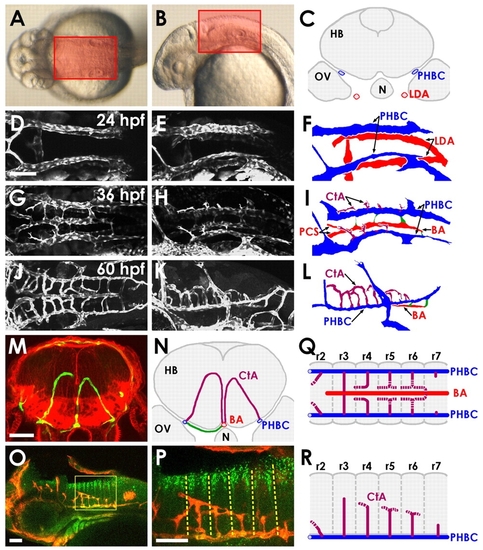
Vascular anatomy of the developing zebrafish hindbrain. (A,B) Transmitted light images of 30 hpf zebrafish, with boxes indicating the dorsal (A) and lateral (B) regions of the hindbrain imaged here. (C) Schematic transverse section of the hindbrain of a 24 hpf zebrafish, showing the locations of the paired venous primordial hindbrain channels (PHBCs) relative to the hindbrain, otic vesicles, notochord and pharyngeal arterial lateral dorsal aortae (LDA). N, notochord; HB, hindbrain; OV, otic vesicle. (D-L) Confocal images of the hindbrain vasculature in Tg(fli1a:EGFP)y1 (D,E,G,H) or Tg(kdrl:GFP) (J,K) embryos at 24 (D-F), 36 (G-I) or 60 (J-L) hpf, with explanatory schematic diagrams of the vasculature at each stage (F,I,L). Images and diagrams include dorsal (D,G,J), dorsal-lateral (E,F,H,I) or lateral (K,L) views. Rostral is to the left. Diagrams show LDA (red), PHBC (blue), basilar artery (BA, red) and central arteries (CtAs, purple). (M) Confocal image of a transverse section at the hindbrain level through a 3 dpf Tg(kdrl:GFP) embryo (green, blood vessels), counterstained with Rhodamine-phalloidin (red, F-actin). (N) Explanatory diagram of the blood vessels and major anatomical structures in M. Connections (green) persist between the PHBC and BA underneath the hindbrain. (O,P) Whole-mount immunofluorescent staining of blood vessels with anti-GFP (red) and of paraboundary cells with anti-DeltaD (green) in a 60 hpf Tg(kdrl:GFP) transgenic embryo. Lateral view, rostral to the left. The boxed area is shown at higher magnification in P. The anti-DeltaD staining efficiently labels rhombomere paraboundary cells, permitting visualization of rhombomere boundaries (dashed lines). (Q,R) Dorsal (Q) and lateral (R) diagrams summarizing the pattern of growth, interconnection and BA linkage of the CtAs. r, rhombomere. Scale bars: 50 μm. EXPRESSION / LABELING:
|
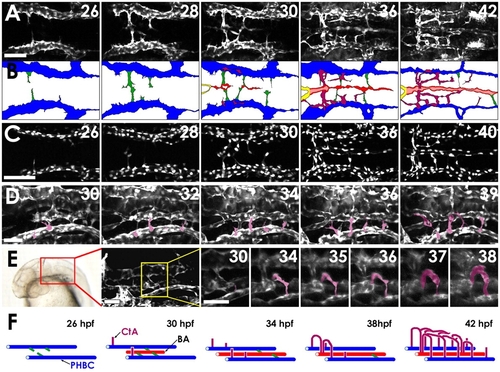
Two-photon time-lapse imaging of the assembling hindbrain vasculature. (A) Dorsal time-lapse images of BA and CtA formation in the hindbrain of a 26-42 hpf Tg(fli1a:EGFP)y1 zebrafish embryo (see Movie 1 in the supplementary material). (B) Diagrams of the vessels in A, showing PHBCs (blue), medial sprouts from the PHBCs giving rise to and temporarily connecting to the BA (green), the assembling BA (red), and CtAs sprouting dorsally from the PHBC to form a network connecting to the BA (purple). (C) Dorsal time-lapse images of BA formation in the hindbrain of a 26-40 hpf Tg(fli1a:nEGFP)y7 embryo (see Movie 2 in the supplementary material). (D) Dorsal-lateral time-lapse images of CtAs sprouting dorsally from the PHBCs in the hindbrain of a 30-39 hpf Tg(fli1a:EGFP)y1 embryo (see Movie 3 in the supplementary material). CtAs emerging from the left PHBC are pseudocolored purple for ease of visualization. (E) Frontal dorsal-lateral time-lapse images of the r3 CtA (pseudocolored purple for ease of visualization) sprouting dorsally from the PHBCs in the hindbrain of a 30-38 hpf Tg(kdrl:GFP) embryo (see Movie 4 in the supplementary material). The red box on the transmitted light image indicates the area visualized in the adjacent confocal image, and the yellow box in that image indicates the area shown at higher magnification in the remaining panels, which includes the r3 CtA. (F) Model of hindbrain vascular development (color scheme as in B). Scale bars: 50 μm in A,C; 25 μm in D,E. |

Central artery formation and patterning. (A,B) Single horizontal section through the hindbrains of 54 (A) and 60 (B) hpf Tg(kdrl:GFP) embryos. The CtA in the third rhombomere (r3) links directly to the BA from early stages (red arrows in A), whereas CtAs in r4 and r5 do not initially connect to the BA. One or two direct connections are also usually present in r6 or r7 (yellow arrow in A) by this stage. Direct connections in r4 and r5 are formed later (blue arrows in B). Each stem of the CtAs in r3 to r6 is indicated by a purple arrowhead. (C,D) CtAs avoid Olig2+ clusters in r5 and r6. Dorsal (C) and lateral (D) view of confocal images in a 48 hpf Tg(fli1a:EGFP)y1; Tg(olig2:DsRed2)vu19 double-transgenic embryo, showing DsRed2-positive neuroepithelial precursors (red) and EGFP-positive blood vessels (green). The CtAs in r5 and r6 (arrows) appear to turn away from and avoid the nearby Olig2+ clusters. (E-H) CtAs are patterned normally in tnnt2a MO-injected ‘silent heart’ animals that lack blood circulation. Confocal images of the hindbrain vasculature in 34 (E,F) and 60 (G,H) hpf Tg(fli1a:EGFP)y1 control (E,G) or tnnt2a (F,H) MO-injected zebrafish embryos. BA, red arrowheads; CtAs, purple arrowheads. Dorsal view, rostral to the left. Scale bars: 50 μm. |

Expression patterns of cxcl12b and cxcr4a. (A-L) Whole-mount in situ hybridization of 24 (A,D,G,J), 32 (B,E,H,K) and 52 (C,F,I,L) hpf wild-type zebrafish embryos, probed for either cxcl12b (A-F) or cxcr4a (G-L). Dorsal (A-C,G-I), lateral (D-F,L) and dorsolateral (J,K) views are shown, with rostral to the left. Arrowheads in A,D, pharyngeal endoderm; arrows in B,E, anterior floor plate; arrowheads in G,J, LDA; arrows in G,J, pharyngeal arches; arrowheads in H,K, BA; arrows in H,K, PHBC. For detailed expression patterns in transverse sections, see Fig. S5 in the supplementary material. Scale bar: 200 μm. |
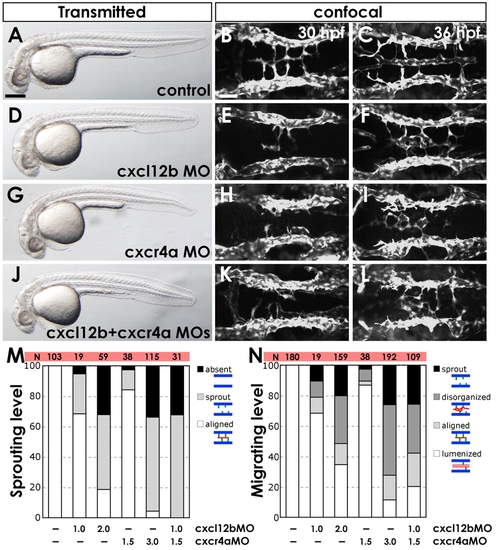
Chemokine signaling is required for hindbrain vascular patterning. (A-L) BA assembly defects are present in cxcr4a MO- and cxcl12b MO-injected Tg(fli1a:EGFP)y1 zebrafish embryos. (A,D,G,J) Transmitted light images of 32 hpf animals; lateral view, rostral to the left. (B,C,E,F,H,I,K,L) Confocal images of the hindbrain vasculature in 30 (B,E,H,K) or 36 (C,F,I,L) hpf animals; dorsal view, rostral to the left. Animals were injected with control MO (A-C), 2 ng cxcl12b-MO2 (D-F), 3 ng cxcr4a-MO2 (G-I), or 1 ng cxcl12b-MO2 + 1.5 ng cxcr4a-MO2 (J-L). (M) The percentage of 30 hpf MO-injected animals with no PHBC sprouts (‘absent’), PHBC sprouts that do not extend to or align along the midline (‘sprout’), or BA endothelial cells aligned along the ventral keel of the hindbrain (‘aligned’, which is normal for this stage). (N) The percentage of 36 hpf MO-injected animals with PHBC sprouts that do not extend to or align along the midline (‘sprout’), BA endothelial cells near the midline but not aligned longitudinally (‘disorganized’), endothelial cells aligned along the ventral keel of the hindbrain but not lumenized (‘aligned’), or with an assembled, lumenized BA (‘lumenized’, which is normal for this stage). For illustration of phenotypic categories, see Fig. S7 in the supplementary material. Scale bars: 250 μm in A; 50 μm in B. |

Abnormal connections between the lateral dorsal aortae and posterior hindbrain channels in cxcr4a morphants. (A-D) Example of a misdirected vessel in cxcr4a MO-injected zebrafish. Confocal images of the hindbrain vasculature in 36 hpf control (A,C) and cxcr4a (B,D) MO-injected Tg(fli1a:EGFP)y1 animals. Dorsal (A,B) and lateral (C,D) views. Abnormal connections between the LDA and PHBC are occasionally observed in cxcr4a morphants (yellow arrows), but are never found in control MO-injected animals. The confocal image stacks used to generate these images are shown in Movies 5 and 6 in the supplementary material. Scale bar: 50 μm. |

Expression of cxcr4a promotes PHBC sprouting and medial migration in cxcr4a MO-injected animals. (A) Co-injection of 200 pg mRNA encoding wild-type cxcr4a alleviates the PHBC sprouting defect in zebrafish injected with 3 ng cxcr4a-MO2. The percentage of 30 hpf Tg(fli1a:EGFP)y1 animals showing endothelial cells migrating medially from the PHBC. The number of embryos analyzed for each injection is shown (N). (B) The Tol2 transposon cassettes of the control (kdrl:egfp) and cxcr4a (kdrl:egfp-2A-cxcr4a) expression vectors; the latter includes the 2A peptide sequence (see Materials and methods). (C,D) Confocal images of the hindbrain vasculature in 36 hpf cxcr4a-MO2-injected Tg(kdrl:mCherry-CAAX)y171 embryos co-injected with either control egfp transgene (C) or with a cxcr4a and egfp co-expression transgene (D). Dorsal view, rostral to the left. (E) Sample confocal image of the hindbrain vasculature in a 36 hpf Tg(kdrl:nls-mCherry)y173 embryo (with red fluorescent endothelial nuclei) injected with cxcr4a-MO2 and control kdrl:egfp transgene (green fluorescent endothelial cell bodies). In this animal, one EGFP-expressing endothelial cell (arrow) has migrated medially from the PHBC, whereas six EGFP-expressing endothelial cells (arrowheads) are present within the PHBC (outlined by a dashed line). Dorsal view, rostral to the left. (F) Quantification (percentage) of the medial migration tendency of transgene-expressing cells. The number of medially migrating EGFP-expressing endothelial cells (one in the example E) out of the total number of EGFP-expressing hindbrain endothelial cells (seven in the example E) was determined in 15 control (kdrl:egfp) and 17 cxcr4a (kdrl:egfp-2A-cxcr4a) animals. The s.e.m. is 2.9 for the control group and 3.9 for the cxcr4a group. The variability range of the two groups was comparable (P>0.1, F-test), and a t-test shows that the two groups are statistically different (P<0.03). (G-J) Confocal images of the hindbrain vasculature in Tg(kdrl:mCherry-CAAX)y171 transgenic host embryos from either wild type (WT) to WT (control MO-injected donor to control MO-injected host) (G), MO to WT (cxcr4a-MO2-injected donor to control MO-injected host) (H), WT to MO (I) or MO to MO (J) transplants. Dorsal view, rostral to the left. Transplanted cells were labeled with Dextran Blue. Transplanted vascular endothelial cells also express EGFP because Tg(fli1a:EGFP)y1 embryos were used as donors. (K) Quantification (percentage) of the medial migration tendency of transplanted cells. The number of medially migrating EGFP-expressing endothelial cells out of the total number of EGFP-expressing hindbrain endothelial cells was determined in ten (WT to WT), 11 (MO to WT), 11 (WT to MO) and nine (MO to MO) injected animals. Average percentages of medially migrated transplanted endothelial cells and s.e.m. were calculated for all groups. Scale bars: 50 μm. |

Transient links between the primordial hindbrain channels and basilar artery. (A) Confocal images of the PHBC, BA and transient endothelial connections between them (red arrows) in the hindbrain of Tg(fli1a:EGFP)y1 animals at 24, 33 and 42 hpf. Dorsal view, rostral is to the left. (B) Quantification of the number of PHBC-to-BA connections present between 24 and 45 hpf (n=10 animals). Error bars indicate s.e.m. Scale bar: 50 μm. |

Central arteries project through the center of the rhombomeres. (A-D) Confocal images of the hindbrain from a single Tg(kdrl:mCherry-CAAX)y171; Tg(pax2a:GFP)e1 double-transgenic embryo at 30 hpf (A,C) and 48 hpf (B,D), showing mCherry-positive blood vessels (A,B) or mCherry-positive blood vessels plus GFP-positive rhombomeres 3 and 5 (r3 and r5) and hindbrain neurons (C,D). The first pair of CtAs (white arrows) project dorsally through the middle of r3 (yellow brackets show r3 and r5), eventually linking directly with the BA. More posterior CtAs can be seen projecting through the center of r4, r5 and r6 (white arrowheads). Dorsal-lateral view, rostral to the left. Scale bar: 50 μm. |

Expression patterns of endothelial markers. (A-V) Whole-mount in situ hybridization of 24 hpf (A,C,E,G,I,K,M,O,Q,S) and 32 hpf (B,D,F,H,J,L,N,P,R,T,U,V) wild-type zebrafish embryos, probed for kdrl (A-D), cadherin 5 (E-H), flt4 (I-L), dab2 (M-P) or dll4 (Q-V). Dorsal view (A,B,E,F,I,J,M,N,Q,R,U) and dorsolateral view (C,D,G,H,K,L,O,P,S,T,V), rostral is to the left. U and V show magnified portions of the hindbrain from R and T, respectively. Expression of kdrl and cadherin 5 is detected in cranial vessels including PHBC (black arrows), BA (arrowheads), and LDA (red arrows). Expression of flt4 and dab2 is detected in venous vessels including PHBCs (black arrows), although reduced at later stages (dashed black arrows). Weak expression of dab2 is also detectable in LDA (red arrows in M,N). Expression of dll4 is detected in arterial vessels, including BA (arrowheads in R,T) and LDA (red arrow in S). Punctate expression of dll4 is also detectable in central areas of the PHBC (black arrows in R,T, and arrowheads in magnified images in U,V). Scale bar: in A, 200 μm for A-T and 62 μm for U,V. |
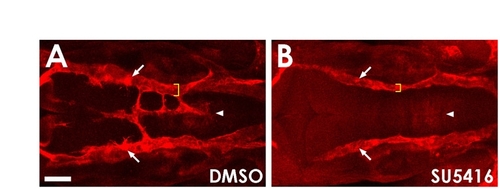
VEGF signaling is required for hindbrain vascular patterning. (A,B) Confocal images of the PHBC, BA and CtA in the hindbrain of 30 hpf Tg(kdrl:mCherry-CAAX)y171 animals treated from 24-32 hpf with either control DMSO carrier (A) or the VEGFR inhibitor SU5416 (B). PHBC sprouting defects are present and BA fails to form (arrowheads) in embryos treated with SU5416 after PHBC assembly. PHBC size (yellow brackets) and CtA sprouting (arrows) are also affected in SU5416-treated embryos. Scale bar: 50 μm. |

Expression domains of cxcl12b and cxcr4a in sections. (A,B) Whole-mount in situ hybridization of 32 hpf wild-type zebrafish embryos probed for cxcl12b (A) or cxcr4a (B). Same images as Fig. 4B,H. (C,D) Transverse sections of A (C) and B (D) at the otic vesicle level in the hindbrain (yellow lines in A and B). Expression of cxcl12b is detected in the hindbrain floor plate (black arrows) and the pharyngeal endoderm (black arrowheads). Expression of cxcr4a is detected in the PHBC (blue arrows), BA (red arrows), LDA (red arrowheads) and CtA (purple arrowhead). Lack of PHBC staining on the left side of this section reflects its discontinuous punctate expression pattern (staining on this side is present in other sections). N, notochord; HB, hindbrain; OV, otic vesicle. EXPRESSION / LABELING:
|

Defects in lateral dorsal aorta formation in cxcl12b and cxcr4a morphants. Lateral dorsal aorta formation is incomplete in cxcl12b and cxcr4a morphants, with gaps between the rostral and caudal portions of these vessels in the head. (A-D) Confocal images of the head vasculature in 24 hpf Tg(fli1a:EGFP)y1 animals injected with control MO (A), 2 ng cxcl12b-MO2 (B), 3 ng cxcr4a-MO2 (C), or 1 ng cxcl12b-MO2 + 1.5 ng cxcr4a-MO2 (D). Dorsal-lateral view. For ease of visualization, the anterior LDA is pseudocolored red, the posterior LDA is pseudocolored green, and veins are pseudocolored blue. Asterisks indicate abnormal gaps in LDA. (E) Quantification of the number of MO-injected embryos with no gaps (′present both′) or with gaps in the right (′absent right′), left (′absent left′), or both LDAs (′absent′) at 24 hpf. MO dosage is indicated (ng). Scale bar: 50 μm. |
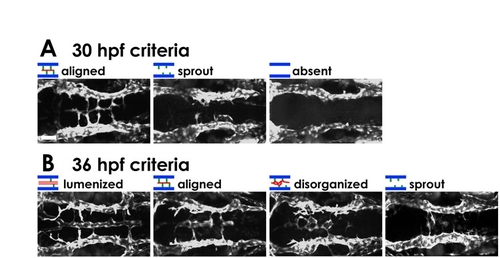
Phenotypic categories in morphants. (A,B) Typical confocal images of each of the categories of hindbrain vascular phenotype in 30 hpf (A) and 36 hpf (B) MO-injected Tg(fli1a:EGFP)y1 embryos. Dorsal view, rostral to the left. Scale bar: 50 μm. |
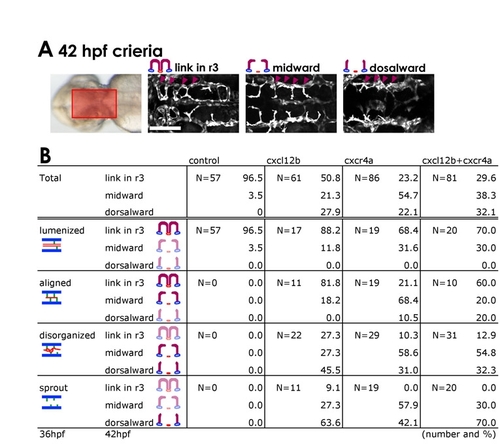
Relationship between central artery and basilar artery phenotypes in cxcr4a morphants. Embryos with more severe BA formation defects subsequently reveal more severe defects in CtA growth towards, and connection to, the BA. (A) Transmitted light image (left) shows the region of the hindbrain imaged in the adjacent panels. The remaining panels show typical confocal images of the three categories of r3 CtA phenotype in 42 hpf MO-injected Tg(fli1a:EGFP)y1 embryos. Embryos were first classified at 36 hpf based on their BA phenotype and then reclassified at 42 hpf based on their r3 CtA phenotype. ′Link in r32, ′midward′ and ′dorsalward′ mean that the CtA in r3 is already linked with the BA (normal for this stage), fully extended dorsally and turned medially or ventral-medially, and extending dorsalwards but not turning medially, respectively. (B) Quantification of 36 hpf BA phenotypes and subsequent 42 hpf r3 CtA phenotypes in the same animals. The number of embryos analyzed for each MO injection (N) and the 36 hpf BA phenotype class is shown in each box, along with the percentages of these embryos that subsequently fall into each of the three CtA phenotypic classes. Scale bar: 50 μm. |

PI3K signaling is required for HUVEC migration in vitro and for PHBC migration in vivo. (A) SDF-1α-induced dose-dependent migration of HUVECs after a 5 hour incubation, measuring the number of transwell-migrated cells. (B) HUVEC transwell migration in response to 100 ng/ml SDF-1α (column 2) and after pretreatment with either 1 mM AMD3100 (column 4) or 10 mM LY294002 (column 6). Shown (A,B) are the mean (with s.e.m.) obtained by measuring eight randomly selected fields of transwell-migrated cells. (C,D) Confocal images of PHBCs and BA in the hindbrain of 32 hpf Tg(fli1a:EGFP)y1 animals treated from 24-32 hpf with either control DMSO carrier (C) or the PI3K inhibitor LY294002 (D). Dorsal view, rostral to the left. Scale bar: 50 μm. |