
- Title
-
A high-throughput screen for tuberculosis progression
- Authors
- Carvalho, R., de Sonneville, J., Stockhammer, O.W., Savage, N.D., Veneman, W.J., Ottenhoff, T.H., Dirks, R.P., Meijer, A.H., and Spaink, H.P.
- Source
- Full text @ PLoS One
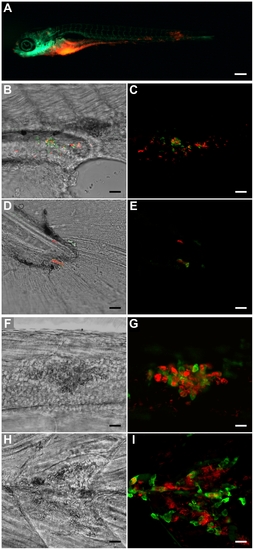
Outcome of M. marinum yolk sac injection of embryos between the 16- and the 512-cell stage. (A) 5 dpi fli1-egfp larva with gfp-labelled vasculature showing spread of bacteria (red) throughout the body (scale bar: 250 μm). (B and D) Bright-field/fluorescence overlay and (C and E) confocal z-stack of red-fluorescent bacteria showing activation of green-fluorescent gags at the (B and C) edge of the yolk extension and on the (D and E) tail of a 7 day-old larva (scale bar: 25 μm). (F and H) Bright-field confocal plane and (G and I) confocal z-stack of red-fluorescent bacteria co-localizing with green-fluorescent leukocytes detected by L-plastin immunostaining (scale bar: 25 μm). The lesions caused by the granulomas can be clearly seen in F and H. PHENOTYPE:
|

Effect of yolk sac co-injection of Pu.1 morpholino and M. marinum on bacterial localization and proliferation within embryos. (A and B) 3 day-old infected mpx-gfp transgenic embryos (A) with and (B) without Pu.1 morpholino (scale bar: 250 μm). Greater numbers of (extracellular) bacteria throughout body of morphant embryo seen in A contrast with lower amount of more localized (phagocytosed) bacteria seen in B. Very low number of mpx-gfp labelled neutrophils in A confirms Pu.1 morpholino effect. (C) Bright-field/fluorescence overlay and (D) confocal z-stack of mag49-GFP/mCherry bacteria in body of 2 dpi embryo (scale bar: 25 μm). Red-fluorescent bacteria form a cording structure adjacent to a few cells containing green-fluorescent (mag49-activated) bacteria. Lack of green fluorescence in cording bacteria indicates no phagocytosis by macrophages and extracellularity. (E) Close-up (digital zoom: 5.2) of cording structure formed by extracellular bacteria (scale bar: 10 μm; only red channel shown). PHENOTYPE:
|

Automatic yolk sac injection of M. marinum and effect of treatment on infected larvae. (A) Effect of treatment on bacterial growth (measured by COPAS) in 5 and 6 day-old fli1-egfp larvae with gfp-labelled vasculature. Blue bars represent treated embryos, red bars represent untreated embryos. (B–D) Untreated versus (E–G) treated 5 day-old larvae, depicted whole in (B and E) bright-field and (C and F) fluorescent images, and (D and G) profiled by COPAS (scale bar: 250 μm). The localization of bacteria (red) in C and F correlates well with COPAS profile peaks in D and G, respectively (peaks in the tail region are shown enlarged in the inset; arrowheads depict two representative locations). |
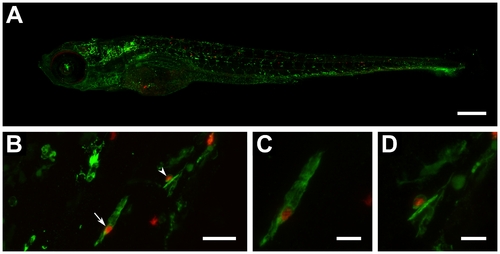
Automatic yolk sac injection of M. tuberculosis and effect of treatment on infected larvae. (A) Confocal z-stack (8×2 stitching) of a 6 day-old whole larva (fli1-egfp with gfp-labelled vasculature) showing spread of bacteria (red) throughout the body (scale bar: 250 μm). (B) Confocal z-stack of red-fluorescent bacteria co-localizing with green-fluorescent leukocytes detected by L-plastin immunostaining (scale bar: 25 μm). (C) Close-up (digital zoom: 4.2) of bacteria-containing leukocyte depicted in B by straight arrow (scale bar: 10 μm). (D) Close-up (digital zoom: 4.3) of bacteria-containing leukocyte depicted in B by arrowhead (scale bar: 10 μm). |