
- Title
-
Clonal analysis by distinct viral vectors identifies bona fide neural stem cells in the adult zebrafish telencephalon and characterizes their division properties and fate
- Authors
- Rothenaigner, I., Krecsmarik, M., Hayes, J.A., Bahn, B., Lepier, A., Fortin, G., Götz, M., Jagasia, R., and Bally-Cuif, L.
- Source
- Full text @ Development

Retro- and lentiviruses differently target the telencephalic ventricular cell types. (A,B) Typical examples of the main cell type targeted by Retro-EF1α:GFP (A) and Lenti-CMV:GFP (B) infections at 7 dpi. Immunostaining for GFP (green), radial glia (S100β, red) and the proliferation marker PCNA (blue) is shown in the telencephalon (80 μm coronal sections; single optical planes observed by confocal microscopy; dorsal upwards; section plane and position of the micrographs shown on the cartoons; ventricle indicated by white bars). (A2,A3,B2) Higher magnifications of the single channels. Scale bars: 10 μm. Arrows indicate the transduced cells of interest. (C) Quantification at 7 dpi of the proportion of cell types I, II and III transduced with the two viruses (left bars, counted across the whole telencephalic VZ). Retroviral infection: 42% type I, 7% type II, 51% type III cells (60 cells from four brains). Lentiviral infection: 73% type I, 19% type II, 8% type III cells (26 cells from four brains). The right panel shows the normal distribution of the three cell types in the telencephalic VZ (type I, 64%; type II, 10%; type III, 26%) (3006 cells counted). Fisher′s test: **P=0.001314 and P=0.001330 (comparison of the proportion of retrovirus-transduced cells and lentivirus-transduced cells, respectively, with the uninfected situation); ***P=0.0001295. |
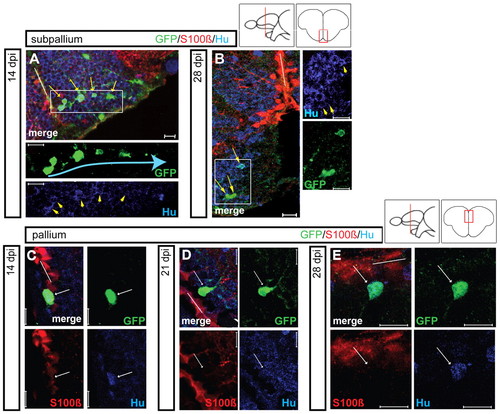
Maturation of GFP-positive cells into newborn neurons in the subpallial and pallial regions. Maturation was followed in the subpallium (upper panels) and pallium (lower panels) at various time points after infection (14, 21 and 28 dpi) (single optical sections from Retro-EF1α:GFP-injected brains, immunostained for GFP, S100β and/or HuC/D, white bars indicate the VZ). (A,B) In the subpallium, the majority of GFP-positive cells express HuC/D at 14 dpi (A, yellow arrows). Some labeled cells seem to move away from the VZ in chain-like assemblies (blue arrow). At 28 dpi, newborn neurons (yellow arrows) are small and exhibit short processes. Single-channel views are magnifications of the boxed areas. In B, all three cells indicated are HuC/D positive. (C-E) In the pallium, newborn HuC/D-positive neurons (white arrows) are still located close to the VZ at 28 dpi. Scale bars: 10 μm. |
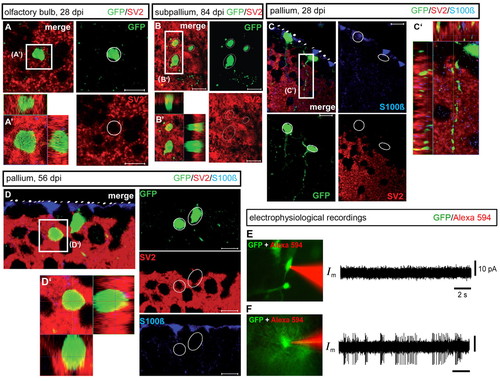
Structural and functional integration of adult-born neuron into existing forebrain neuronal networks. (A-D2) Immunohistochemical detection of GFP (green), S100β (blue) and the synaptic marker SV2 (red) on cross-sections of the OB (A,A2), subpallium (B,B2) or pallium (C-D2) at 28, 56 or 84 dpi (confocal z-section images and orthogonal projections). Scale bars: 10 μm. (E,F) Cell-attached electrophysiological recordings of GFP-positive cells. (E) Example of a GFP-positive cell 2 weeks post-infection that did not exhibit spontaneous action potentials. (F) Example of a GFP-positive cell 7 weeks post-infection with spontaneous action potentials (green, GFP-positive cells; red, contents of the patch pipette). Both right-panel horizontal and vertical scale bars are the same in E and F. |
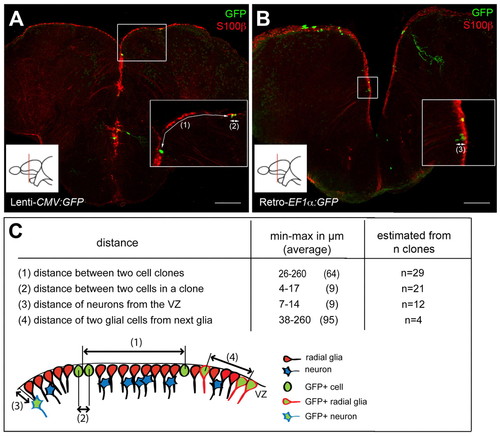
Conditions used for clonal analyses. (A,B) Composite z-stack images of typical slices analyzed, showing the density of single cells and cell clones per slice, revealed in a double immunocytochemistry for GFP (green) and S100β (red). Insets show magnified views of the boxed areas, numbers in brackets refer to the distances described in C. Scale bars: 100 μm. (C) Distance separating clones and cells within a clone at 28 dpi. We considered as a single clone cells that were adjacent (distance between cell centers reached a maximum of 17 μm in one case with two very elongated cells), and separated from the next cell (group) by at least 25 μm. n, number of clones counted from a minimum of four sections from four brains for each distance. |
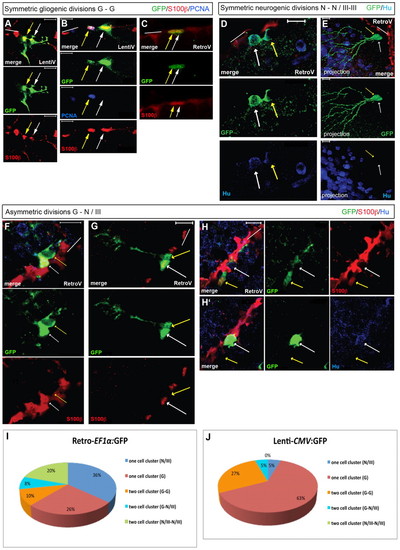
Analysis of cell divisions at the single cell level. All brains were analyzed at 21-28 dpi. Brain sections were immunostained with GFP, S100β (red), HuC/D or PCNA. We considered S100β-negative cells to be fated towards a neuronal identity in cases where only a double labeling for S100β and GFP was used (cells referred to as ‘III’, indicating a neuroblast identity). S100β-positive cells are identified as glia (‘G’) and HuC/D-positive cells as neurons (‘N’) (single confocal planes of merged fluorescence and single fluorescence pictures, ventricular zone indicated by white bars). In E, a projection of several confocal stacks is illustrated; the two daughter cells are indicated by white and yellow arrows. (A-C) Gliogenic divisions (‘G-G’) observed after lentiviral (A,B) or retroviral (C) transduction. In B, the section is stained for PCNA, illustrating self-renewal. (D,E) Symmetric neurogenic divisions traced using a retrovirus. In both cases, the GFP-positive daughters are located away from the VZ (red). In E, these cells do not express detectable HuC/D levels, but harbor a developed dendritic tree. (F-H2) Asymmetric divisions generating a radial glia and a S100β-negative neuroblast (F,G) or neuron (H) (H and H2 are two adjacent focal planes of the same section). (I,J) Quantification of the one- and two-cell clones observed after 21-28 dpi for each viral type (retrovirus: 50 cell clones in four brains, lentivirus: 22 cell clones in four brains). Scale bars: 10 μm. |

Notch activity modulates proliferation rate within the glia and neuroblast populations. (A,B) Effect of Notch blockade on cell proliferation at the VZ 14-28 days after lentiviral injection (see F), visualized on cross-sections double-stained for GFP (green) and PCNA (blue) (ventricle delimited by the dotted line). Scale bars: 50 μm. (C) Example of a symmetric gliogenic division occurring upon Notch blockade. The section is triple-stained for S100β (red), GFP (green) and PCNA (blue). The left panel is the merged image of the boxed area in B (confocal projection of a 7 μm stack) and right panels are single channel views of optical sections taken at different z planes to visualize the two daughter cells (white and yellow arrowheads). Both cells are PCNA positive. Scale bar: 20 μm. (D,E) Number of clones (D) and proportion of clones (E) of each division type (G-G, symmetric gliogenic; III-III, symmetric neurogenic; G-N/III, asymmetric) in control (DMSO) or LY411575 (LY)-treated brains 14-28 days after lentiviral injection. In E, P>0.3 in a Fisher′s exact test. Number of PCNA-positive glial cells generated from G-G divisions: two in DMSO-treated and four in LY-treated brains. (F) Scheme of the Notch blockade experiment. |

Viral transduction of zebrafish cells in culture and through in vivo injections into the ventricle of the adult zebrafish brain. (A,B) Retroviral MLV-based constructs (CAG or EF1α promoter) and lentiviral HIV-based constructs (CMV or EF1α promoter) used in this study. All self-inactivating viral vectors possessed an internal promoter to drive gfp expression. Ψ indicates retroviral packaging signal. (C,D) Flow-cytometry analysis (histograms) of GFP production after transfection (upper panels) and infection (lower panels) with retro- (C) and lenti- (D) viral vectors in zebrafish PAC2 cells (left panels) and (as control) human 293T cells (right panels). In all analyses, untransduced cells were monitored as control. In transfection experiments, the plasmid pCS2:gfp (pGFP) was used as control. This analysis identifies the retrovirus EF1α:GFP and the lentivirus CMV:GFP as the best combinations of promoters and virus types in zebrafish. (E) Schematic drawing (sagittal view) of the injection site into the telencephalic brain ventricle of the adult zebrafish brain. Solutions were injected anterior to the epiphysis. (F) Control injections with FluoSphere beads showed that the injected solution spreads throughout the ventricular region dorsal and ventral views of the brain at two days post-infection (dpi). (G-L) GFP expression in brains infected with Retro-EF1α:GFP (G,I,K) and Lenti-CMV:GFP (H,J,L) at 7 dpi (confocal stack projections, cross-sections at the levels indicated). The VZ is depicted with white dots. GFP expression could be detected in all ventricular areas, including telencephalon (G,H), mesencephalon (I,J) and medulla oblongata (K,L). Cce, corpus cerebellis; Hyp, hypothalamus; OB, olfactory bulb; Te, telencephalon; TeO, optic tectum; Val, Valvula. |
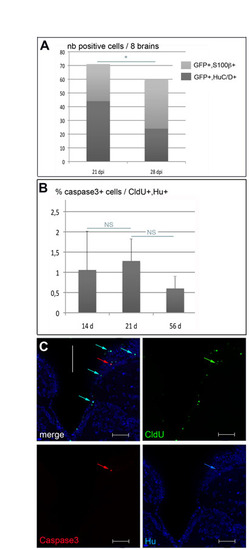
Loss of GFP-positive neurons over time and cell death analysis in the adult pallium. (A) Number of GFP-positive cells that co-express neuronal (HuC/D, blue) or glial (S100β, red) markers in the pallium at 21 and 28 dpi following retroviral infection (n=8 in each case). The differences observed are significant (unpaired t-tests, *P=0.01 and 0.018, respectively, for S100β-positive and Hu-positive cells). (B) Percentage of CldU, HuC/D double-positive cells that co-express the caspase 3 apoptotic marker 14, 21 and 56 days after CldU incorporation (calculated from a total of 353, 937 and 902 CldU+, HuC/D+ cells counted on 27, 29 and 18 slices, respectively, n=4 in each case). The proportion of dying newborn neurons is very low (respectively 1.05, 1.28 and 0.6%) and does not significantly vary with the age of the adult-born HuC/D-positive cells (unpaired t-tests: P>0.4 for both pair-wise comparisons). (C) Triple immunostaining for CldU (green), HuC/D (blue) and caspase 3 (red) in the adult pallium 21 days after a 24-hour CldU pulse. Numerous CldU+, HuC/D+ cells are visible (cyan arrows in top left panel), of which one co-expresses caspase 3 (red, green and blue arrows). Cross-sections of the telencephalon observed in confocal microscopy, white bar to the midline. Scale bars: 50 μm. |