
- Title
-
Integration of Hedgehog and BMP signalling by the engrailed2a gene in the zebrafish myotome
- Authors
- Maurya, A.K., Tan, H., Souren, M., Wang, X., Wittbrodt, J., and Ingham, P.W.
- Source
- Full text @ Development
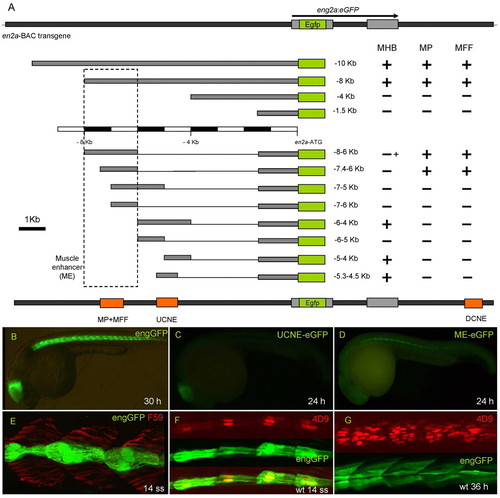
Identification of cis-regulatory elements in the zebrafish eng2a gene. (A) Schematic representation of the eng2a:eGFP BAC transgene, its deletion derivatives and the enhancers that they identify; the activity of each construct in the MHB, MP cells and MFF is indicated by a + or - sign (+ indicates low-level expression). The dotted box indicates the limits of the 2 kb fragment referred to throughout as the ME. (B-D) Whole-mount lateral views (anterior to left, dorsal up) of: a 30 hour Tg(eng2a:eGFP)i233 embryo showing eGFP expression in the MHB and MP/MFF population (B); a 30 hour Tg(eng2a:eGFP)i243 embryo showing eGFP expression restricted to the MHB (C); a 30 hour Tg(eng2a:eGFP)i236 embryo showing eGFP expression restricted to the MP/MFF population (D). Note that in D the levels of eGFP expression are relatively low, such that only the MP expression is clearly visible at low magnification. (E) Parasagittal optical section of anterior trunk region of a 14 ss Tg(eng2a:eGFP)i233 embryo showing myotomal expression restricted to a subset of the slow fibres revealed by staining with the mAb F59 antibody. (F,G) Similar preparations of F, a 14 ss Tg(eng2a:eGFP)i233 embryo stained with mAb 4D9 showing coincidence of expression (lower merged image) of the transgene (middle image) and the endogenous Eng proteins (upper image), and G, a 36 hour Tg(eng2a:eGFP)i233 stained with mAb 4D9; the transgene is now expressed in both MPs and multinucleate MFFs. UCNE/DCNE: upstream/downstream conserved non-coding element (conserved from fish to mammals). EXPRESSION / LABELING:
|
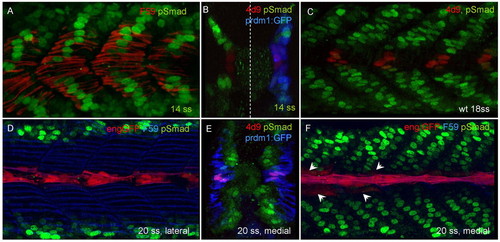
Activated Smads display a dynamic pattern of nuclear accumulation during zebrafish myotomal development. (A,B) Medial parasagittal optical and transverse sections of 14 ss embryos showing nuclear accumulation of pSmad (green) in slow myoblasts, marked by F59 (red) staining in A and prdm1a:GFP expression (blue) in B; the blue channel has been suppressed on the left-hand side of this panel to aid visualisation of the red and green signals. Note absence of accumulation in cells closest to the midline in both cases. These latter cells are the presumptive MPs. (C) 18 ss wild-type embryo showing the mutually exclusive pattern of Eng (4D9) and pSmad accumulation. (D-F) Lateral and medial parasagittal optical sections and transverse section of 20 ss Tg(eng2a:eGFP)i233 embryos. After the outward migration of slow fibres labelled with F59 (blue) in D, F, and prdm1:GFP (blue) in E, pSmad accumulates in a subset of medially located fast fibres, except for those at the midline, closest to the notochord that express the transgene (red in D,F) and endogenous Eng, revealed by 4D9 (red in E). Note that at this stage, most eng expression is still restricted to MPs, but is starting to initiate in MFFs in more anterior somites (arrows in F). EXPRESSION / LABELING:
|
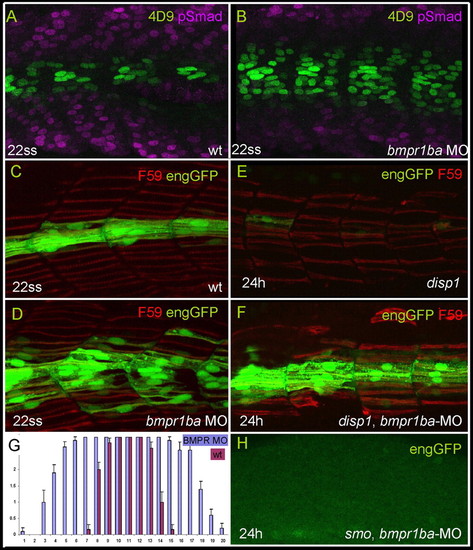
Inhibition of Smad activity de-represses engrailed expression. (A,B) Parasagittal optical sections of 22 ss embryos showing distribution of Eng (4D9) and pSmad in wild type (A) and bmpr1ba morphants (B). Somites shown are at the level of the yolk sac. (C,D,G) Attenuation of BMPR1ba causes ectopic expression of eng2a. The histogram in G compares eGFP expression in Tg(eng2a:eGFP)i233 embryos injected with bmpr1ba morpholino, with that in non-injected controls; bars represent the frequency of eGFP expressing slow fibres at different dorsoventral positions. Positions 8-13 represents the horizontal myoseptum. Morphants display a wide expansion of the eGFP domain. Data based on three consecutive somites at the end of yolk extension in 22 ss embryos. x axis, dorsoventral position; y axis, number of eGFP+ fibres. Error bars indicate s.d. Representative examples are shown in C,D. (E) Parasagittal optical sections of a 24 hour Tg(eng2a:eGFP)i233;disp1tf18b mutant embryo displaying reduced slow fibres (F59; red) and near absence of eng2a:eGFP. (F) Similarly staged Tg(eng2a:eGFP)i233; disp1tf18b mutant embryo that was injected with bmpr1ba morpholino at the one- to two-cell stage, showing robust rescue of eGFP expression. (H) Parasagittal optical sections of a 24 hour Tg(eng2a:eGFP)i233; smob641 mutant embryo injected with bmpr1ba morpholino at one- to two-cell stage, showing complete absence of eng2a:eGFP expression. Inhibition of Smad activity de-represses engrailed expression. (A,B) Parasagittal optical sections of 22 ss embryos showing distribution of Eng (4D9) and pSmad in wild type (A) and bmpr1ba morphants (B). Somites shown are at the level of the yolk sac. (C,D,G) Attenuation of BMPR1ba causes ectopic expression of eng2a. The histogram in G compares eGFP expression in Tg(eng2a:eGFP)i233 embryos injected with bmpr1ba morpholino, with that in non-injected controls; bars represent the frequency of eGFP expressing slow fibres at different dorsoventral positions. Positions 8-13 represents the horizontal myoseptum. Morphants display a wide expansion of the eGFP domain. Data based on three consecutive somites at the end of yolk extension in 22 ss embryos. x axis, dorsoventral position; y axis, number of eGFP+ fibres. Error bars indicate s.d. Representative examples are shown in C,D. (E) Parasagittal optical sections of a 24 hour Tg(eng2a:eGFP)i233;disp1tf18b mutant embryo displaying reduced slow fibres (F59; red) and near absence of eng2a:eGFP. (F) Similarly staged Tg(eng2a:eGFP)i233; disp1tf18b mutant embryo that was injected with bmpr1ba morpholino at the one- to two-cell stage, showing robust rescue of eGFP expression. (H) Parasagittal optical sections of a 24 hour Tg(eng2a:eGFP)i233; smob641 mutant embryo injected with bmpr1ba morpholino at one- to two-cell stage, showing complete absence of eng2a:eGFP expression. EXPRESSION / LABELING:
PHENOTYPE:
|
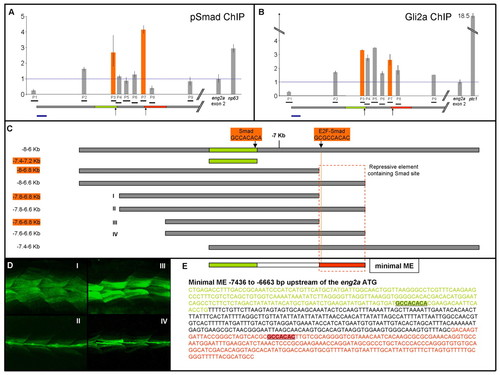
Phospho-Smads and Gli2a bind the ME in the zebrafish embryo. (A) qPCR detection of DNA fragments (P1-P9) within the eng2a ME (horizontal grey bar: the regions shaded green and red correspond to the correspondingly coloured sequences shown in E) in chromatin precipitated from 14 ss embryo nuclear extracts using the pSmad antibody. Fragment sizes (bp): P1,146; P2, 119; P3, 102; P4, 120; P5, 145; P6, 124; P7, 117; P8, 117; P9, 114. The y-axis indicates fold changes normalised to a fragment within the second exon of the eng2a gene. Enrichment of a fragment upstream of the np63 transcription unit provides a positive control. Orange bars denote enrichment of fragments containing putative Smad-binding sites, indicated in C and E. Enrichments are normalised against input chromatin and also against IgG-precipitated chromatin. Error bars represent s.d. derived from qPCR repeats from the same ChIP preparation; the enrichments shown are from a single ChIP. Similar enrichments were obtained in biological repeats of ChIP preparations. (B) qPCR detection of DNA fragments (P1-P9; as described above) within the eng2a ME in chromatin precipitated from 14 ss embryo nuclear extracts using the αGli2a antibody. Enrichment of a fragment upstream of the ptc1 transcription unit serves as a positive control. (C) ME deletion constructs assayed for activity in stable transgenic lines (listed in Table 1). Fragment lengths boxed in orange indicate those that show ectopic expression. The dotted orange box indicates a putative repressor element revealed by this analysis. (D) Examples of ectopic eGFP expression in embryos from transgenic lines Tg(eng2a:eGFP)i247 (I) and Tg(eng2a:eGFP)i249 (III) and normal expression in lines Tg(eng2a:eGFP)i248 (II) and Tg(eng2a:eGFP)i250 (IV). (E) Nucleotide sequence of the eng2a minimal ME showing the two putative Smad-binding sites: the more distal of these (highlighted in green) lies in a region (shown in green) absolutely required for ME activity; the more proximal site (highlighted in red) lies in a region required for ME repression. Scale bar: 200 bp in A and B. EXPRESSION / LABELING:
|
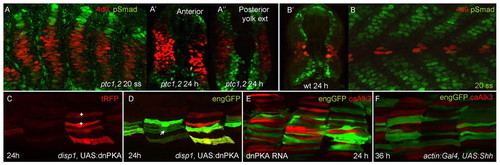
Modulation of Smad accumulation and Eng expression by Hh and BMP pathway activity. (A-A′) Parasagittal optical section and transverse sections at different levels along the rostrocaudal axis of ptc1hu1602;ptc2tj222 double homozygous mutant embryo at 20 ss and 24 hours, respectively, showing vastly expanded MPs (revealed by 4D9, red) and reciprocal loss of pSmad accumulation (green) compared with wild-type embryo at a similar stage (B,B′). Note expansion in domain of pSmad accumulation dorsally and ventrally in ptc mutants, especially at more caudal levels; compare with 24 hour wild-type embryo (B′). (C,D) Parasagittal optical sections of Tg(actin:GAL4);Tg(eng2a:eGFP)i233; disp1tf18bmutant embryo injected with UAS:dnPKA;tRFP at one- to two-cell stage. Most tRFP expressing fibres are also eGFP+ve, consistent with an autonomous effect of Hh pathway activity on eng2a induction. Note that not all fibres expressing tRFP (C) ectopically activated eng2a:eGFP (*); conversely, one eGFP+ve fibre (marked by an arrow in D) was tRFP–ve; this possibly represents a fibre induced by residual Hh signalling activity, as is sometimes observed in disp1tf18bmutant embryos. (E,F) Merged images of 24 hours Tg(eng2a:eGFP)i233 embryos expressing caALK3 under actin:GAL4 control in which the Hh pathway has been activated by injection of dnPKA mRNA or of UAS:Shh DNA. (E) dnPKA injection results in the ectopic activation of the eng2a:eGFP transgene (green) but this is suppressed in cells expressing caALK3 (red). Similarly, (F) late expression of Shh activates the eng2a:eGFP transgene in fast twitch fibres but this is suppressed by caAlk3 (red). On average, only 1.4 out of 13 tRFP+ve fibres also expressed eGFP (n=22 hemisegments from seven embryos). EXPRESSION / LABELING:
|
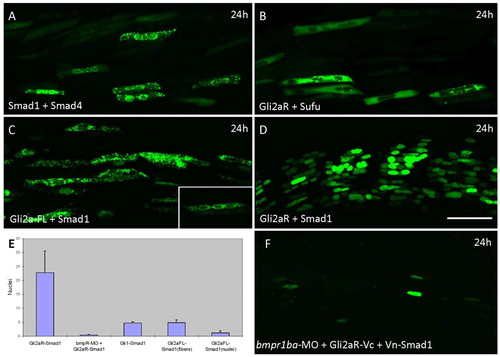
Bi-fluorescence complementation assay for in vivo protein-protein interactions. Parasagittal sections of live embryos injected with constructs expressing Vn- and Vc-tagged protein pairs from the same UAS promoter and imaged at 24 hours. (A) Smad1/Smad4: note speckled appearance of signal, which shows a cytoplasmic and perinuclear localisation. (B) Gli2aR/SuFu; signal is localised to the cytoplasm and excluded from the nucleus. (C) Gli2a-FL/Smad1; note speckled appearance of signal, which shows a cytoplasmic and perinuclear localisation (see inset). (D) Gli2aR/Smad1; most fibres in each somite are positive for the Venus signal, localised exclusively to the nucleus. (E) Histogram showing frequency of Venus+ve fibres in embryos injected with different Gli/Smad combinations. Error bars indicate s.d. based on≥5° hemisegments from five different embryos. (F) Gli2aR/Smad1 co-injected with bmpr1ba morpholino: the majority of fibres in each somite are negative for Venus. |

Spatio-temporal distribution of pSmad in wild-type and manipulated embryos. (A-A″) Parasagittal optical sections of posterior somites in a 14 ss zebrafish embryo, showing pSmad marks the most dorsal and ventral adaxial cell nuclei, before their stacking and onset of Engrailed. (B-B″) Parasagittal optical section of a 14 ss embryo labelled with pSmad, mAb F59 (slow fibres) and DAPI, showing a lack of pSmad in slow fibre nuclei close to the notochord. The same section is shown as in Fig. 2A. (C,C′) Parasagittal optical section of a 24 hour embryo injected with dnPKA RNA and UAS:caALK3-UAS:tRFP showing complimentary pattern of 4d9 (purple) and pSmad (green); high levels of pSmad are induced in the cells expressing tRFP (red). (D,D′) Parasagittal optical sections of a 24 hour actin:GAL4 embryo injected with UAS:dnPKA-UAS:tRFP (red) showing cell-autonomous induction of eng2a:eGFP by dnPKA-expressing clones. (E) Cross-sections from a 20 ss embryo along different anteroposterior levels, marked with pSmad, mAb 4D9 and prdm1:GFP (slow muscle, blue). Younger/posterior somites display pSmad marking slow fibres, whereas in older/anterior somites pSmad marks a medial population of fast fibre muscle nuclei. (F) Cross-section of a 24 hour embryo injected with dnPKA RNA and marked wih pSmad and mAb 4D9. |

Bi-molecular fluorescence complementation analysis of interacting and non-interacting partners. Parasagittal optical sections of live embryos injected with various constructs expressing Vn- and Vc-tagged proteins from the same UAS promoter and imaged at 24 hours (except in B). (A) Full-length Gli2a and SuFu. Signal is similarly localised to the cytoplasm and excluded from the nucleus. Note punctate accumulations in some fibres. (B) Truncated Gli2a and Smad4 imaged at 40 hours. A few nuclei show signal. (C) Gli1 and SuFu. Signal is localised to the cytoplasm and excluded from the nucleus (inset). (D) Gli1 and Smad1. Note speckled appearance of signal, which shows a cytoplasmic and perinuclear localisation. |