
- Title
-
Antagonistic interactions of hedgehog, Bmp and retinoic acid signals control zebrafish endocrine pancreas development
- Authors
- Tehrani, Z., and Lin, S.
- Source
- Full text @ Development

Pdx1 is increased in Hh-deficient embryos by 24 hpf. (A-D) pdx1 expression at 16.5 hpf (A,B) and 28 hpf (C,D) in wild-type (A,C), cyclopamine-treated (B) and smo1a590 mutant (D) zebrafish embryos. At 16.5 hpf, pdx1-expressing cells (white arrowheads) begin converging at the midline (A), and by 28 hpf they have coalesced into a single cluster corresponding to the dorsal pancreatic bud (black arrowhead) (C). In Hh signaling-deficient embryos, the stripes of pdx1 expression are expanded (D) and remain separated (B,D) as pdx1-expressing cells fail to initiate medial migration. (E,F) hnf1ba expression in the foregut (arrows) at 30 hpf in smo1a590 mutants (F) versus wild type (E). (G,H) cpa2 expression in the exocrine pancreas at 3 dpf in smo1a590 mutant embryos (H) versus wild type (G). All images in A-H are dorsal views, anterior to the left. (I) qPCR of pdx1 and ptc1 expression levels at different developmental stages in embryos lacking Hh signaling (mean ± s.e.m.). Expression of pdx1 was initially reduced at 16.5 hpf but significantly elevated at 24 hpf in cyclopamine-treated embryos as compared with untreated controls and at 26 hpf in smo1a590 mutants as compared with wild-type siblings. Asterisks denote a significant change versus control by at least two s.d. (J) A representative image of dissociated cells from a cyclopamine-treated Tg(pdx1:GFP) embryo at 28 hpf. (K) Quantification of GFP+ cells in untreated (wt) and cyclopamine-treated (cyc) Tg(pdx1:GFP) embryos at 28 hpf. The y-axis indicates the number of GFP+ cells. All cyclopamine (25 μM) treatments were initiated at 2 hpf until harvest. |
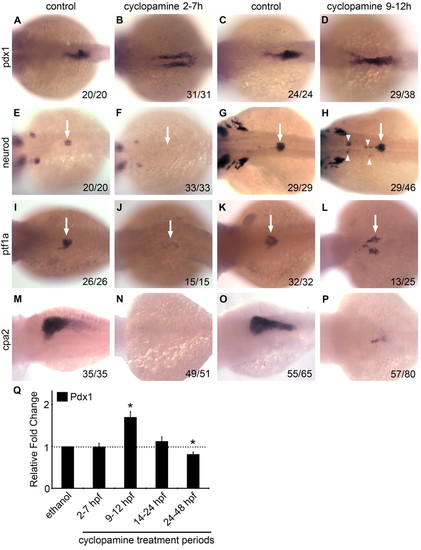
Effects of transient cyclopamine treatment on exocrine and endocrine pancreas differentiation. (A-P) Dorsal views (anterior to the left) of wild-type zebrafish embryos transiently treated with cyclopamine (25 μM) either 2-7 hpf (B,F,J,N) or 9-12 hpf (D,H,L,P) versus untreated controls (A,E,I,M and C,G,K,O) and examined at 24 hpf for pdx1 (A-D) and neurod (E-H), at 48 hpf for ptf1a (I-L) and at 3 dpf for cpa2 (M-P) expression. The number of embryos displaying similar expression patterns is indicated in each case. In cyclopamine 2-7h embryos, pdx1-expressing cells fail to migrate towards the midline (A,B) and both islet and exocrine pancreas specification fail as assessed by neurod (E,F, arrows), ptf1a (I,J, arrows) and cpa2 (M,N) expression. In cyclopamine 9-12h embryos, pdx1 expression appeared expanded (C,D) and multiple clusters of neurod-expressing cells were detected at ectopic sites (G,H, arrowheads) anterior to the normal expression domain in the endogenous islet (G,H, arrow) at 24 hpf. At 48 hpf, cyclopamine 9-12h embryos show bilateral expression of ptf1a in exocrine precursors (K,L, arrows), whereas expression of cpa2 at 3 dpf in the acinar cells was reduced (O,P). (Q) Relative fold change in pdx1 expression in embryos exposed to cyclopamine transiently during various developmental periods (error bars show s.e.m.). Asterisks indicate a significant change (at least 2 s.d.) compared with control. Embryos treated during 24-48 hpf were harvested at 48 hpf and all others were harvested at 24 hpf. |

Elevated levels of Hh signaling impair RA-mediated induction of ectopic endocrine pancreas in the anterior endoderm. (A-O) Dorsal views (anterior to left) of pdx1 (A-C), insulin (D-F), neurod (G-I) and hhex (J-L) expression at 24 hpf and ptf1a (M-O) expression at 48 hpf, comparing embryos transiently treated from 9-10 hpf with DMSO (A,D,G,J,M), retinoic acid (RA; 1 μM) (B,E,H,K,N) or RA plus purmorphamine (25 μM) (C,F,I,L,O). Brackets indicate ectopic expression and arrowheads indicate endogenous expression. The number of embryos displaying similar expression patterns is indicated in each case. (P) qPCR of pdx1 expression at 24 hpf in DMSO-, RA- and RA plus purmorphamine-treated embryos (error bars show s.e.m.). Asterisks indicate a significant change (at least 2 s.d.) compared with control. |

Decreased Hh signaling leads to increased numbers of RA-induced pdx1-expressing cells. (A-D) Dorsal views (anterior to left) of pdx1 expression at 32 hpf in DMSO-treated wild-type (A), RA-treated wild-type (B), DMSO-treated smo1a590 mutant (C) and RA-treated smo1a590 mutant (D) zebrafish embryos. RA treatment (1 μM) from 9-10 hpf induced more pdx1-expressing cells in smo1a590 mutants (D) than in wild-type embryos (B). Note the migration defect (arrows) of pdx1-expressing cells in RA-treated smo1a590 mutants (D) as compared with RA-treated wild types (B). The number of embryos displaying similar expression patterns is indicated in each case. Asterisks indicate embryos with mixed genotypes (smo+/+, smo+/–, smo-/-) from smo1a590 carrier parents. |
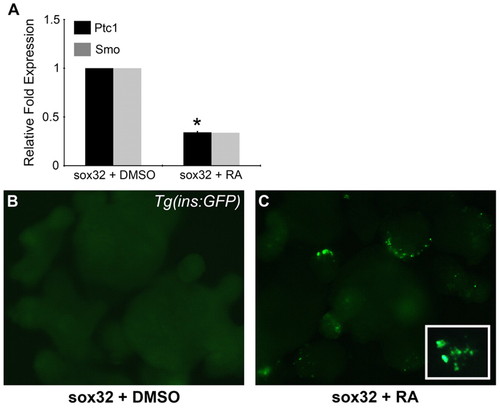
RA downregulates the Hh receptor ptc1 in endodermal explants. (A) qPCR of ptc1 and smo expression levels in RA-treated zebrafish endodermal explants (mean ± s.e.m.). Asterisk indicates a significant change (at least 2 s.d.) compared with control. (B,C) Tg(ins:GFP) endodermal explants treated with DMSO (B) or 1 μM RA (C). To create the endoderm explants, sox32 mRNA was injected into Tg(ins:GFP) embryos at the 1-cell stage (see text). |
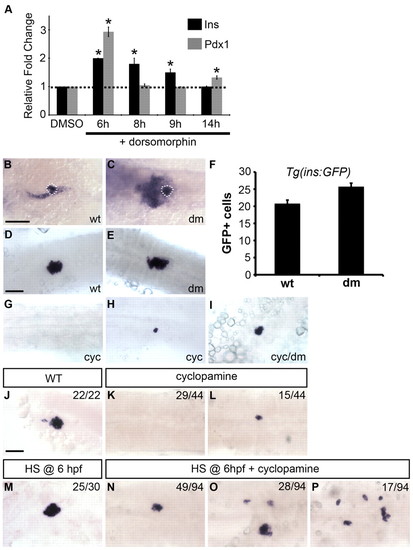
Decrease in Bmp signaling partially rescues dorsal bud-derived β-cells in Hh-deficient embryos. (A) qPCR of insulin and pdx1 expression at 24 hpf in wild-type embryos treated with dorsomorphin (15 μM) or DMSO starting at 6, 8, 9 or 14 hpf until harvest (mean ± s.e.m.). Treatment during gastrulation enhanced both pdx1 and insulin transcript levels. Asterisks indicate a significant change (at least 2 s.d.) compared with control. (B,C)The pdx1 expression domain at 24 hpf is expanded in embryos treated with dorsomorphin (dm) starting at early gastrulation (6 hpf) (C) as compared with untreated embryos (B). White dotted lines outline the dorsal pancreas. (D,E,G-I) insulin expression at 24 hpf in wild-type embryos treated with ethanol plus DMSO (D), dorsomorphin (E), cyclopamine (cyc) (G,H) and cyclopamine plus dorsomorphin (I). Treatment with dorsomorphin began at ∼6-7 hpf until harvest. (F) Quantification of Tg(ins:GFP)-expressing cells in 24-hpf embryos treated with dorsomorphin starting at 6 hpf. (J-P) Embryos obtained from outcrosses of hemizygous Tg(hsp70l:dnBmpr-GFP)w30 adult zebrafish were incubated in cyclopamine, heat shocked (HS) at 6 hpf, and examined for insulin expression at 24 hpf. In cyclopamine-treated control embryos, insulin expression was either absent (K) or severely reduced (L) as compared with wild type (J). In heat shocked Tg(hsp70l:dnBmpr-GFP)w30 embryos, insulin expression and islet size were increased (M). When Bmp activity was reduced by heat shock at 6 hpf in cyclopamine-treated embryos, insulin expression was partially rescued (N-P). Based on islet size and morphology, embryos were scored into three phenotypic classes: small cluster (N), medium cluster (O) or scattered (P). Cyclopamine (25 μM) treatments started at 2 hpf until harvest. The number of embryos displaying similar expression patterns is indicated in each case. All images are dorsal views, anterior to the left. Scale bars: 100 μm in B; 50 μm in D. |
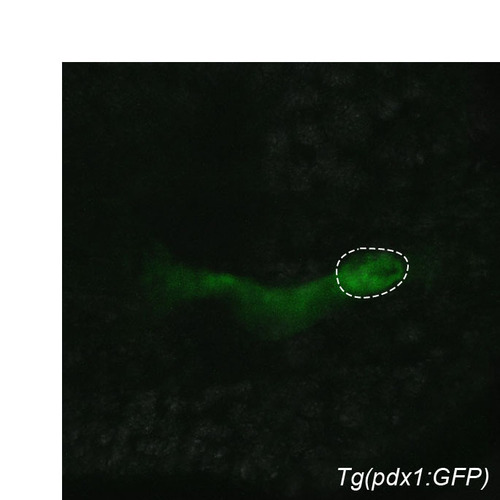
Transgenic (pdx1:GFP). Confocal image of Tg(pdx1:GFP) expression at 28 hpf. Dorsal view, anterior to the left. Dashed line outlines the primary islet. |
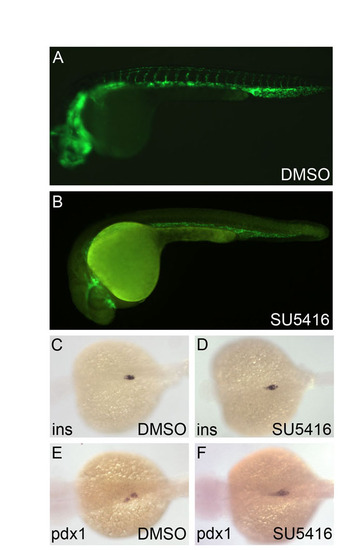
Inhibition of the Vegf pathway does not affect pancreas development. (A-F) Tg(flk1:GFP) embryos were treated with the Vegf pathway inhibitor SU5416 (5 µM) starting from 6 hpf and examined at 24 hpf under a fluorescence microscope and by in situ hybridization for insulin and pdx1 expression. Although vascular development was disrupted (A,B), insulin (C,D) and pdx1 (E,F) expression patterns appeared unaffected, confirming the specificity of the effect of dorsomorphin on zebrafish pancreas formation. |