
- Title
-
Mapping a sensory-motor network onto a structural and functional ground plan in the hindbrain
- Authors
- Koyama, M., Kinkhabwala, A., Satou, C., Higashijima, S.I., and Fetcho, J.
- Source
- Full text @ Proc. Natl. Acad. Sci. USA
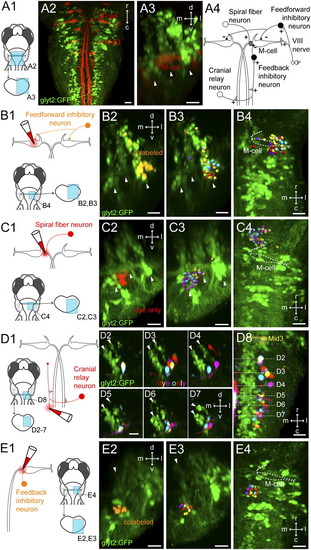
Retrograde labeling of prospective interneurons in the Mauthner circuit. (A) Location of the M-cell relative to glycinergic neurons in the hindbrain. (A1) Location of images on right. (A2) Dorsal view of a Tg(glyt2:GFP) line at 5 dpf with reticulospinal neurons backfilled from the spinal cord with Texas Red. (A3) Cross-section view of the M-cell and the three glycinergic stripes at rhombomere 4. White arrowheads mark the glycinergic stripes. (A4) Circuit diagram of the Mauthner circuit from goldfish. Excitatory neurons, white; inhibitory neurons, black. (B) Retrograde labeling of potential feedforward inhibitory neurons. (B1) Experimental diagram. (B2) Cross-section view of the backfilled neurons at rhombomere 4 in the Tg(glyt2:GFP) line at 5 dpf. Colabeled voxels are orange. Arrowheads mark glycinergic stripes. (B3) Cross-section from registrations showing the glycinergic neurons from four example fish, with different colored spheres for each. (B4) Top-down view of neurons in B3. White dashed line marks the M-cell. (C) Retrograde labeling of prospective spiral fiber neurons. (C1) Experimental diagram. (C2) Cross-section at rhombomere 3 in the Tg(glyt2:GFP) line at 5 dpf. Voxels that only contain the far red dye used to backfill are shown in red. (C3) Cross-section of the registered reconstructions for three different fish, as in B3. (C4) Top-down view of neurons in C3. M-cell marked by white dashed line. (D) Retrograde labeling of potential cranial relay neurons. (D1) Experimental diagram. (D2–D7) Backfilled neurons from four different fish shown in registered cross sections in rhombomere 7/8. Arrowheads mark medial and middle glycinergic stripes. (D8) Top-down view of the neurons in D2–D7. White lines mark corresponding cross sections. (E) Retrograde labeling of prospective feedback inhibitory neurons. (E1) Experimental diagram. (E2) Cross-section of glycinergic neurons at rhombomere 5 in the Tg(glyt2:GFP) line at 5 dpf. Orange indicates colabeling with GFP and the far red dye. White arrowhead marks medial glycinergic neurons. (E3) Cross-section of the registered reconstructions from four fish. (E4) Top-down view of the same neurons. r/c, rostral and caudal; d/v, dorsal and ventral; m/l, medial and lateral in this and later figures. (Scale bars, 20 μm.) |

Feedforward inhibitory neurons. (A1) Pairwise whole-cell recording of a GFP-positive feedforward inhibitory neuron and the ipsilateral M-cell from a Tg(glyt2:GFP) x relaxed line at 4 dpf. (A2) Firing the feedforward neuron led to PSPs (average of five traces) in the M-cell that inverted below threshold (black) and were blocked by strychnine (1 μM, gray). (A3) Response of the feedforward inhibitory neuron to single spikes in the M-cell. (A4) Eighth nerve stimulation led to firing of the interneuron and an EPSP in the M-cell. (A5) Top-down view of the feedforward inhibitory neuron (green) and the M-cell (red) from A2 relative to the glycinergic neurons (blue). (A6) Cross-section of the same neurons, in rhombomere 4. Arrowheads mark glycinergic stripes. (B1 and B2) Location in top-down (B1) and cross-section views (B2) of 12 registered feedforward inhibitory neurons (orange spheres) identified by pairwise recordings. Arrowheads mark the glycinergic stripes. (C) Morphology of feedforward inhibitory neurons (16 cells). One cell is excluded owing to poor filling. (C1) Box-and-whisker plots showing the extent of axonal projections in four directions: ipsilateral ascending (ia), ipsilateral descending (id), contralateral ascending (ca), and contralateral descending (cd). The whiskers extend to the most extreme data point, which is no more than 1.5 times the interquartile range from the box. Asterisk marks the line for the neuron in C2. (C2) Example reconstruction; dotted line marks the midline. (Scale bars, 20 μm.) |
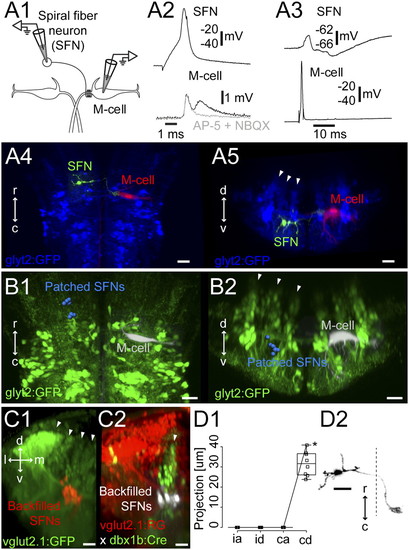
Spiral fiber neurons. (A1) Pairwise recording of a GFP-negative spiral fiber neuron at rhombomere 3 and the contralateral M-cell in the Tg(glyt2:GFP) x relaxed line at 4 dpf (Left). (A2) Firing the spiral fiber led to EPSPs (black) in the M-cell. The slow component of the EPSPs was blocked by the glutamatergic blockers 10 μM NBQX and 100 μM d-AP5 (gray). (A3) PSP in the spiral fiber neuron in response to firing the M-cell. (A4 and A5) Top-down and cross-section views of the spiral fiber neuron (green) and the M-cell (red) from A2 and A3 relative to the glycinergic neurons (blue). Arrowheads mark the glycinergic stripes. (B1 and B2) Summary of the locations of eight spiral fiber neurons (blue) in the glycinergic line in rhombomeres 4 and 5, laid out as in Fig. 2B. (C1) Cross-section view of the backfilled spiral fiber neurons (red) in the transgenic glutamatergic line [Tg(vglut2.1:GFP)] at rhombomere 3. Arrowheads mark the glutamatergic stripes. (C2) Cross-section of the backfilled spiral fiber neurons (white) in the Tg(vglut2.1:RG x dbx1b:Cre) line. Arrowhead indicates the dbx1b-positive middle glutamatergic stripe (green). (D1 and D2) Projections of the spiral fiber neurons shown as in Fig. 2C. Asterisk on D1 marks a point on the line for the neuron in D2. (Scale bars, 20 μm.) |
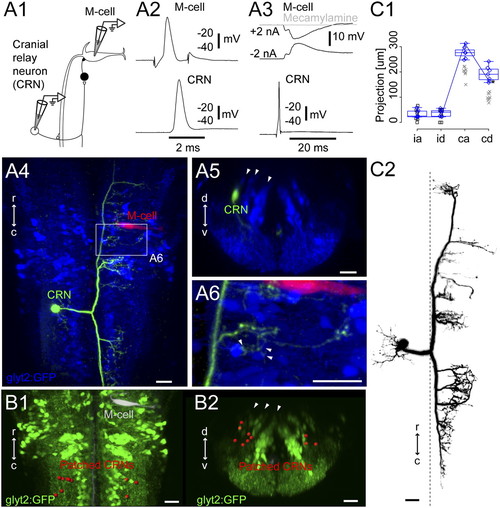
Cranial relay neurons. (A1) Pairwise recordings of a GFP-negative cranial relay neuron at rhombomere 7/8 and the contralateral M-cell in the Tg(glyt2:GFP) x relaxed line at 4 dpf. (A2) Firing the M-cell led to an action potential in the cranial relay neuron. (A3) Firing the cranial relay neuron with current injection led to a long-latency IPSP in the M-cell (black) that was blocked by application of the cholinergic blocker mecamylamine (100 μM, gray). (A4) Top-down view of the recorded cranial relay neuron (green) and the M-cell (red) relative to glycinergic neurons (blue). (A5) Cross-section of the cranial relay neuron at rhombomere 8. Arrowheads mark glycinergic stripes. (A6) Close up of axonal terminations from the cranial relay neuron in region of the white rectangle in A4 showing apposition (arrowheads) to glycinergic neurons in the region. (B1 and B2) Locations of 10 cranial relay neurons at rhombomeres 7/8 (red) identified with pairwise recordings, in top-down (B1) and cross-section (B2) views. (C1 and C2) Summary of the morphology of seven cranial relay neurons, laid out as in Fig. 2C. Xs mark neurons whose whole axonal extent was not captured after recording. Box-and-whisker plots are from seven electroporated cells marked with blue diamonds whose whole axonal extent was captured. Asterisk marks a point on the line shown for the neuron in C2. (Scale bars, 20 μm.) |

Feedback-inhibitory neurons. (A1) Pairwise recordings from a feedback-inhibitory neuron at rhombomere 5 and the ipsilateral M-cell in the Tg(glyt2:GFP) x relaxed line at 4 dpf. (A2) Firing the M-cell led to an action potential in the feedback neuron. (A3) Firing the feedback inhibitory neuron led to an IPSP in the M-cell that was blocked with 1 μM strychnine (gray line). (A5 and A6) Top-down (A5) and cross-section (A6, at rhombomere 5) views of the recorded feedback-inhibitory neuron (green) and the M-cell (red) relative to the glycinergic neurons (blue). Arrowhead marks the most medial glycinergic neurons. (B1 and B2) Summary of the position of nine recorded feedback-inhibitory neurons (pink) in top-down (B1) and cross-section (B2) views at rhombomere 5. Arrowhead marks the medial glycinergic stripe. (C1) Hemicross-section of backfilled feedback-inhibitory neurons (red) in the Tg(glyt2:GFP) at 5 dpf, immunostained forengrailed-1 (En1, blue). (C2) Single electroporated feedback neuron (FB) stained for engrailed (αEn1), and the merged image. (D1 and D2) Morphology of feedback-inhibitory neurons (n = 7 cells) formatted as in Fig. 2 C1 and C2. Black Xs mark two cells whose whole axonal extent was not captured. Asterisk marks the line for the neuron in D2. (Scale bars, 2 μm in C2, 20 μm in other panels.) |