
- Title
-
Brother of cdo (umleitung) is cell-autonomously required for Hedgehog-mediated ventral CNS patterning in the zebrafish
- Authors
- Bergeron, S.A., Tyurina, O.V., Miller, E., Bagas, A., and Karlstrom, R.O.
- Source
- Full text @ Development
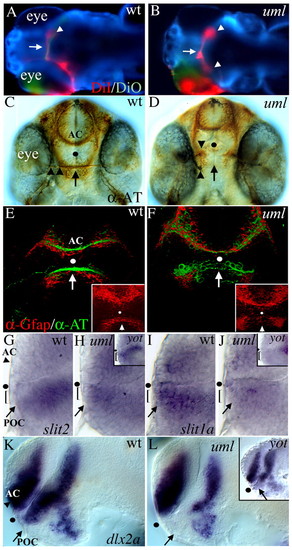
Axon guidance and forebrain patterning defects in umleitung (uml) mutants. (A,B) DiI (red) and DiO (green) labeling of retinal ganglion cell (RGC) axons from the left eye at 5 days postfertilization (dpf). Dorsal views, anterior to the left. In wild-type zebrafish (A), all RGC axons cross the midline (arrow) to innervate the contralateral tectal lobe (arrowhead). In uml mutants (B) some RGC axons fail to cross the midline (arrow) and instead project to the ipsilateral tectal lobe, leading to bilateral projections (arrowheads). (C,D) Anti-acetylated tubulin (AT) labeling of forebrain axons at 48 hpf. Ventral views, anterior uppermost. In wild-type embryos (C), axons cross the midline to form the anterior commissure (AC) in the telencephalon and the post optic commissure (POC, arrow) in the diencephalon. RGC axons (arrowheads) grow along the POC (arrow) to the midline to form the optic nerve and optic chiasm. In uml mutants (D), RGC axons fail to reach the midline at this age (arrowheads) and the POC fails to form (arrow), whereas the AC forms normally in the telencephalon. (E,F) Anti-Gfap (red) and anti-AT (green) labeling of glia and axons in the forebrain at 36 hpf. Ventral views, anterior at the top. Insets show Gfap labeling alone. In wild-type embryos (E), glial cells span the midline adjacent to the AC and POC (arrow). In uml mutants (F), the posterior glial bridge is disrupted, leaving a gap at the midline (arrow). (G-L) In situ hybridization (ISH) showing gene expression in the anterior forebrain at 30 hpf. (G) Lateral views, anterior to the left, eyes removed. slit2 (and slit3, not shown) is expressed posterior and ventral to the POC (arrow), but not in cells (bracket) that lie between the POC and optic recess (dot). (H) In uml and yot (inset) mutants, slit2 expression is expanded into the region between the POC and the optic recess (black dot). (I) In contrast to slit2 and slit3, slit1a is expressed between the POC and optic recess (bracket) in wild-type embryos. (J) slit1a expression in this region is reduced in uml mutants (bracket) and absent in yot mutants (inset). (K) dlx2a is regionally expressed in the AC region (arrowhead) of the telencephalon and POC region (arrow) of the diencephalon. (L) In uml mutants, dlx2a expression is absent in the POC region. These expression defects are nearly identical to those seen in the yot (inset). Dots mark the optic recess in C-L. |

Reduced Hh signaling in uml mutants. (A) The Hh target gene ptc1 (now known as ptch2) is expressed throughout the ventral CNS in wild-type embryos with a dorsal peak of expression in the zona limitans interthalamica (ZLI) (arrowhead). (B) In uml mutants, ptch2 expression is greatly reduced throughout the brain and spinal cord, and is nearly absent from the ZLI (arrowhead). (C) foxa2 is expressed in the ZLI (arrowhead) and ventral midbrain/hindbrain (bracket). (C2) In the spinal cord, foxa2 is expressed in the medial floor plate (FP, arrowhead) and lateral FP cells that correspond to the V3 region of the mammalian spinal cord (arrows). (D,D′) In uml mutants, foxa2 expression is reduced in the brain and is absent from the lateral floor plate (D′ arrows). (E,E′) nkx2.9 is expressed in the diencephalon (arrowhead in E), ventral midbrain/hindbrain (bracket) and in lateral FP cells (arrows in E′). (F,F′) In uml mutants, nkx2.9 expression is completely absent throughout the CNS. (G,G′) nkx2.2a is expressed in the diencephalon (arrowhead in G), ventral midbrain/hindbrain (bracket) and lateral floor plate of the spinal cord (arrows in G′). (H,H′) In uml mutants nkx2.2a expression is reduced in the diencephalon (arrowhead in H), ventral midbrain/hindbrain (bracket), and spinal cord (arrows in H′). (I,I′) olig2 is regionally expressed in the diencephalon (arrowheads) and in a band of cells in the spinal cord just dorsal to the floor plate (arrowhead in I′). (J,J′) In uml mutants, olig2 expression is regionally absent in the diencephalon (arrowheads in J) and expression is reduced and shifted ventrally in the spinal cord (arrowhead in J′). (K,K′) nkx6.1 is expressed in the ventral midbrain (arrowhead in K), hindbrain (bracket in K) and in the ventral half of the spinal cord (bracket with arrowhead in K′). (L,L2) In uml mutants, nkx6.1 expression is reduced in the brain (arrowhead and bracket in L) and shifted ventrally in the spinal cord (bracket with arrowhead in L′). (M,M′) pax7 is expressed in the dorsal midbrain (arrowheads in M), hindbrain (bracket in M), and spinal cord (bracket with arrowhead in M′). Inset shows pax3 expression. (N,N′) In uml mutants, pax7 (and pax3, inset) expression appears unchanged. A-N are lateral views of the heads of 24 hpf zebrafish, anterior to the left, eyes removed. Black dots mark the optic recess. C′-N′ are spinal cord cross-sections of embryos shown in C-N. In C′-N′, arrows mark the lateral floor plate and arrowheads mark the floor plate. In I′-N′, brackets with arrowheads mark the dorsoventral boundary of gene expression within the spinal cord. In C, D, M and N nkx2.2a labeling (red) was used to identify uml mutants. Upper right panel is a schematic representation of Hh target gene expression in the spinal cord of wild-type (left) and uml mutant (right) embryos. d, diencephalon; fb, forebrain; hb, hindbrain; mb, midbrain; sc, spinal cord; som, somites; t, telencephalon. |

boc morpholino (MO) injections cause uml-like defects. (A) A control MO-injected 48 hpf embryo. (B) uml mutants have curved body axes at this stage. (C) Injection of a translation blocking boc MO results in a curved body axis similar to that seen in uml mutants. (D) Normal nkx2.2a expression in the ventral forebrain and midbrain (arrowhead) of a control MO-injected embryo. (E) Regional loss of nkx2.2a expression seen in uml mutants (arrowheads). (F) Injecting boc MO results in the loss of nkx2.2a expression in the same regions as in uml mutants (arrowheads). (G) Zn-5 antibody labeling at 48 hpf showing RGC axons that have crossed the midline by 48 hpf to form the optic chiasm (arrowhead). (H) In uml mutants, RGC axons fail to cross the midline (arrowhead) and grow aberrantly in the ventral forebrain (arrows). (I) boc MO injections can result in specific retinal axon defects (arrowheads) that are remarkably similar to those seen in uml. A-C are lateral views of live zebrafish. D-F are lateral views of the head, eyes removed, anterior to the left. G-I are ventral views of the head, anterior uppermost. |

boc mRNA injections rescue Hh signaling defects in uml mutants and weakly activate Hh signaling ectopically. (A) Wild-type nkx2.9 expression in the brain and lateral floor plate (inset, arrow). (B) Ectopic nkx2.9 expression was not detected by in situ hybridization after injecting 250 pg of boc mRNA. (C) By contrast, injecting 100 pg of shh mRNA led to ectopic nkx2.9 expression throughout the CNS (arrowheads). (D) nkx2.9 is absent in uml mutants. (E) Injecting 250 pg of boc mRNA into uml mutants partially rescued nkx2.9 expression (arrowheads) in the brain and spinal cord. (F) Injecting 100 pg of shh mRNA into uml mutants partially rescued nkx2.9 expression defects and led to ectopic nkx2.9 expression (arrowheads), but at much lower levels than in wild-type embryos. (G) Wild-type nkx2.2a expression in the brain and floor plate visualized in the Tg(nkx2.2a:megfp) reporter line (Ng et al., 2005). (H) Injecting 250pg of boc mRNA led to weak ectopic nkx2.2a expression only in regions close to the Shh responsive domain of the CNS (arrows). (I) Injecting 100 pg of shh mRNA led to strong ectopic nkx2.2a expression throughout the CNS (arrows). (J) Regional absence of nkx2.2a expression in uml mutants visualized using the Tg(nkx2.2a:megfp) reporter line. (K) Injecting 250 pg of boc mRNA into uml mutants rescued nkx2.2a expression defects in the brain (arrowhead). (L) Injecting 100 pg of shh mRNA into uml mutants also rescued nkx2.2a expression defects (arrowhead) and led to ectopic nkx2.2a expression in the brain (arrows), but at much lower levels than in wild-type embryos (compare with I). All panels show lateral views the head at 24 hpf, anterior to the left, eyes removed. Insets show lateral views of the trunk (A-F, arrows indicate the floor plate) or combined DIC and fluorescent images (G-L). d, diencephalon; fb, forebrain; hb, hindbrain; mb, midbrain; nc, notochord; sc, spinal cord; som, somites; t, telencephalon. |
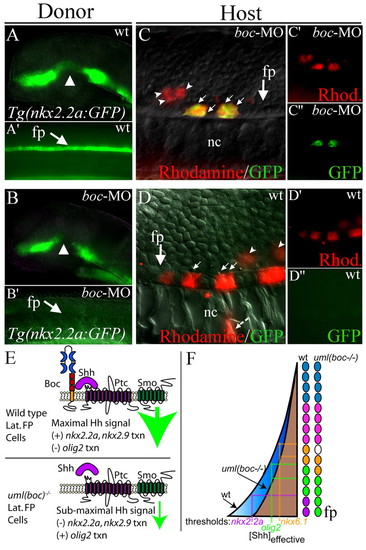
boc is required cell-autonomously for Hh target gene expression in the ventral spinal cord. (A,A′) GFP expression in a Tg(nkx2.2a:megfp) transgenic donor embryo reports wild-type nkx2.2a expression in the forebrain (A) and spinal cord (A′, lateral view of trunk). (B,B′) Loss of Boc function (boc MO injection) leads to the regional loss of nkx2.2a expression in the forebrain (arrowhead in B) and complete loss of nkx2.2a expression in the floor plate (arrow in B′) in 100% of injected embryos (see Fig. 4). (C-C′) Example of transplanted wild-type cells (Rhodamine; red) in a host embryo that lacks Boc function (boc MO-injected). Wild-type donor cells that are located in the floor plate region (arrows) express nkx2.2a despite the lack of boc function in surrounding cells. More dorsally located cells do not express the nkx2.2a:megfp transgene (arrowheads). nkx2.2a expression was seen in 23 cells in four embryos in this experimental paradigm. For clarity, C′ and C′ show Rhodamine and GFP fluorescence alone. (D) A wild-type host embryo containing cells that lack boc function (from boc MO-injected donors as seen in B). In this scenario, no cells were found that expressed the nkx2.2a:megfp transgene, even when transplanted cells were located in the floor plate region. A total of 59 cells in the floor plate region of six embryos were assayed in this experimental paradigm. For clarity, D′ and D′ show Rhodamine and GFP staining alone. (E) Schematic model of Hh signal levels in wild-type or Boc deficient cells. Boc binding to Shh could facilitate the binding of Shh to Ptc, increasing local concentrations of Shh or the length of binding time, thus generating a maximal Hh signal (large green arrow). Without Boc, the Hh signal is reduced (small green arrow). (F) Schematic model of spinal cord Hh signaling levels in the presence (blue) or absence (brown) of Boc function. Colored circles depict individual cells in the zebrafish spinal cord. Loss of Boc function might lower the effective concentration of Shh in the ventral spinal cord, eliminating expression of genes that require the highest levels of Hh signaling for transcriptional activation (e.g. nkx2.2a). Expression domains for genes with slightly lower Shh thresholds are shifted ventrally. fp, floor plate; nc, notochord. |

boc and cdo expression during zebrafish development. (A) Dorsal view of the head, anterior left. Inset shows lateral view. At 10 hours postfertilization (hpf), boc is expressed in the presumptive forebrain, eye and central nervous system, with higher expression ventrally (inset). (B,C) Lateral views of the trunk, anterior left. (B) boc is first expressed in the ventral spinal cord at -10 hpf (arrow). (C) Expression of the Hh target gene nkx2.2a is first detected in the ventral CNS between 12 and 14 hpf (arrow). (D,E) Cross-sections through the trunk. (D) By 12 hpf boc is strongly expressed in the dorsal CNS, with weaker ventral expression remaining (arrow). boc is also expressed in the somites. (E) boc continues to be expressed in the dorsal spinal cord at 16 hpf. cdo is expressed in a similar dorsal domain (inset). Arrowhead marks the floor plate.(F-I) Lateral views of the head, eyes removed. (F) At 15 hpf, boc is regionally expressed in the telencephalon (arrowhead), dorsal midbrain (arrows) and hindbrain. cdo is expressed in a more restricted dorsal domain than boc (inset). (G) At 24 hpf, dorsal boc expression (arrows) is complementary to ventral nkx2.2a expression (red arrowheads) in the brain and spinal cord (inset, in cross-section). Low levels of boc expression can be detected in the region of the developing pituitary (black arrowhead). (H) In uml mutants identified by defects in nkx2.2a expression (red arrowheads), boc expression is slightly reduced in the dorsal brain and spinal cord (arrows). (I) cdo expression is similar to boc expression, with the cdo expression domain being more dorsally restricted in the brain (arrows) and spinal cord (inset, lateral view of trunk). (J) Cross-section through the trunk showing boc expression in the dorsal spinal cord (arrows) and in slow muscle fibers of the lateral somites (arrowheads). (K) At 30 hpf boc is expressed in the telencephalon, dorsal anterior diencephalon and tectum. (L) At 30 hpf boc is also expressed in the choroid fissure of the eye (arrow). (M) boc expression is dramatically downregulated in shh mRNA-injected embryos (arrows) whereas nkx2.2a expression is expanded dorsally (red arrowheads). (N) boc expression is expanded ventrally in the Hh pathway mutant smoothened (arrows) whereas nkx2.2a expression is absent (red arrowhead). (O) cdo expression is relatively unchanged in uml mutants compared with wild type (inset shows lateral view of trunk). (P) At 48 hpf boc is regionally expressed in the brain and in the developing branchial arches (arrows). (Q,R) At 5 days post fertilization (dpf) boc continues to be expressed in the dorsal CNS (Q) and in the lateral margin of the eye (R, arrows). Dots mark the optic recess in F-I and M-O. anr, anterior neural ridge; cb, cerebellum; di, diencephalon; fb, forebrain; fp, floor plate; hb, hindbrain; nc, notochord; sc, spinal cord; som, somite; tec, tectum; tel, telencephalon; y, yolk. EXPRESSION / LABELING:
|

Pituitary, jaw and muscle defects in uml(boc) mutants. (A,B) Lateral views of the anterior/ventral forebrain at 24 hpf. (A) The Hh target gene nkx2.2a is expressed in epidermal cells that form the pituitary placode (bracket, red dashes show border with the hypothalamus). (B) In uml mutants, nkx2.2a expression is reduced in the forming placode (bracket, B). (C-F) Ventral views of the forebrain at 48 hpf. (C) prolactin (prl) (red) and growth hormone (gh1) (purple) expressing cells in wild type. (D) uml mutants have no gh expressing cells and severely reduced prl cell numbers, similar to yot(gli2DR) (inset). (E) pomc expression in the hypothalamus (arrows) and anterior (aa) and posterior (pa) halves of the adenohypophysis in wild type. (F) In uml mutants, pomc cells in the hypothalamus are disorganized (arrows) and pomc cell numbers are reduced in the anterior half of the pituitary placode. pomc expression in the posterior half of the adenohypophysis is relatively unchanged. Again, this is similar to the yot Hh pathway mutant (inset F). (G) Average endocrine cell numbers in the adenohypophysis of uml mutants and wild-type individuals showing a significant reduction in prl, anterior pomc (pomca) and gh cells, but not tsh or posterior pomc (pomcp) expressing cells. *P<0.0001. (H-K) Lateral views of the head at 3 and 7 dpf. (H,I) The lower jaw (arrow) is visibly larger at 3 dpf in uml mutants (I) than in wild type (H). (J,K) By 7 dpf the lower jaw is expanded ventrally in uml mutants (K) relative to wild type (J). (L-Q) Alcian Blue staining of cartilage elements and Alizarin Red staining of bone. (L,M) Cartilage elements are expanded ventrally and the jaw is often in an open position in uml mutants (M) relative to wild type (L). (N,O) Ventral views of dissected upper jaws. In uml mutants (O), the cranial bone (red) is thinner relative to wild type (N) and the trabeculae (arrows) are fused at the midline. (P,Q) Ventral views of dissected lower jaws. In uml mutants (Q), cartilage elements (arches) appear slightly thicker and the lower jaw is wider than in wild type (P). This is in contrast to the reduced lower jaw seen in other Hh pathway mutants (Brand et al., 1996). (R,S) Dorsal views of the posterior trunk at 15 hpf. (R) In wild-type embryos, myoD is expressed in newly formed somites and slow muscle precursor (adaxial) cells adjacent to the notochord. (S) uml(boc) mutants have reduced myoD expression in adaxial cells. (T,U) Lateral views of somites 17-19 at 24 hpf. (T) The F59 antibody labeling of slow muscle fibers in wild type. (U) Some slow muscle fibers are absent in some but not all segments of uml(boc) mutants (arrowhead). (V) uml mutants have significantly fewer slow muscle fibers in the trunk (P< 0.0001). Wild-type embryos have an average of 72 slow fibers in somites 17-19 whereas uml(boc) mutants have an average of 57 fibers in these segments. aa, anterior adenohypophysis; cart, cartilage; hy, hypothalamus; pa, posterior adenohypophysis. EXPRESSION / LABELING:
|
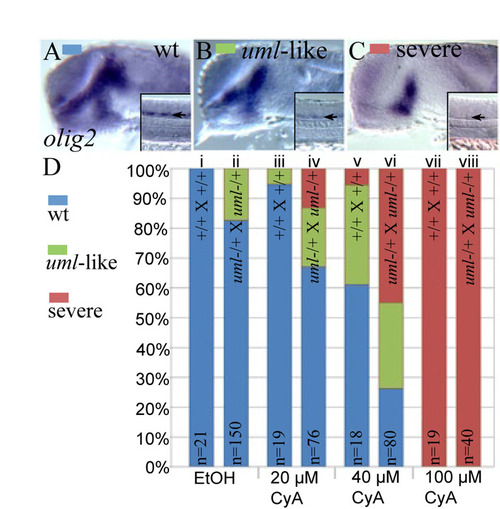
uml(boc) mutants and heterozygotes are hypersensitive to reduced Hh signaling. (A-C) Representative images showing olig2 expression in the forebrain and spinal cord (insets). Lateral views, eyes removed. (A) Wild-type olig2 expression. (B) Reduced olig2 expression as seen in uml mutants. (C) Severely reduced olig2 expression seen in the absence of Hh signaling. (D) Bar graph showing the percentage of embryos with the different olig2 expression patterns shown in A-C. Clutches were derived from wild-type (+/+) or uml+/- heterozygous parents as labeled on each column. (i) 100% of embryos derived from wild-type parents had normal olig2 expression when treated with 1% ethanol (EtOH, control for CyA treatments). (ii) 17% of embryos from uml+/- heterozygous parents had reduced olig2 expression, indicating that this phenotype is not fully penetrant. (iii) 20 µM CyA treatments had little effect on olig2 expression in wild-type embryos. (iv) 20 μM CyA treatments led to severely reduced olig2 expression in 13% of embryos derived from uml+/- heterozygous parents and moderately reduced olig2 expression in 20% of these embryos. (v) 40 μM CyA treatments led to moderately reduced olig2 expression in 33% of wild-type embryos and severe reductions in 6% of embryos, pointing to variability in the CyA response. (vi) 40 μM CyA treatments caused severe olig2 defects in 45% of embryos from uml+/- heterozygous parents. (vii, viii) CyA concentrations above 100 μM led to severely reduced olig2 expression in 100% of embryos, regardless of genotype. |