
- Title
-
Characterization of spatial and temporal expression pattern of Col15a1b during zebrafish development
- Authors
- Bretaud, S., Pagnon-Minot, A., Guillon, E., Ruggiero, F., and Le Guellec, D.
- Source
- Full text @ Gene Expr. Patterns

Temporal expression pattern of zebrafish Col15a1b gene. RT-PCR was performed using RNA isolated from wild type embryos from 2.5 hpf to 72 hpf. RT-PCR for β-actin was used as positive control. EXPRESSION / LABELING:
|
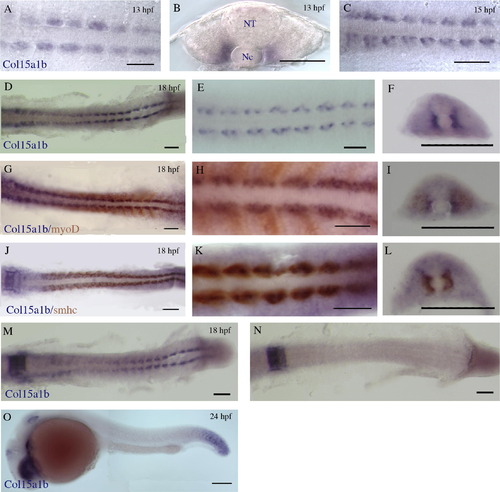
In situ hybridization of Col15a1b antisense RNA probe on whole-mount zebrafish embryos at 13 hpf (8-somite), 15 hpf (12-somite); 18 hpf (18-somite stage), and 24 hpf. (A and C–E) Dorsal views of the trunk region of embryos hybridized with the Col15a1b probe at 13 hpf, 15 hpf and 18 hpf. (B and F) Cross-sections in the trunk region of 8 hpf and 18 hpf-hybridized embryos (Nc: notochord; NT: neural tube). (G and H) Dorsal views and (I) cross-section in the trunk region of an 18 hpf embryo double hybridized with Col15a1b and myoD probes. (J and K) Dorsal views and (L) cross-section in the trunk region of an 18 hpf embryo double hybridized with Col15a1b and smhc probes. (M and N) Dorsal views of 18 hpf embryos hybridized with Col15a1b probe after (N) or not (M) cyclopamine exposure. (O) Lateral view of a 24 hpf embryo hybridized with Col15a1b probe. Scale bar = 100 μm for C, D, F, G, I, J, L, M–O, and 50 μm for A, B, E, H, and K. EXPRESSION / LABELING:
|
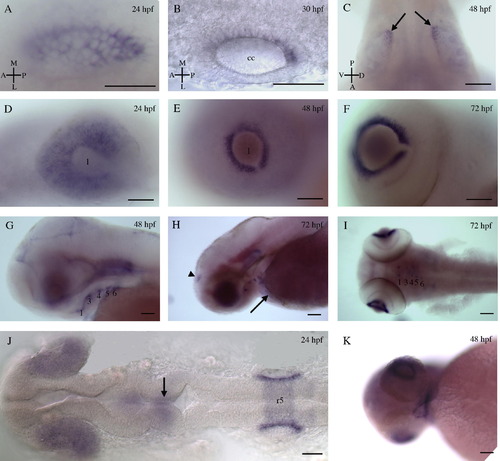
In situ hybridization of Col15a1b antisense RNA probe on whole-mount zebrafish embryos at 24 hpf, 30 hpf, 48 hpf, and 72 hpf. (A and B) Lateral views of the otic vesicle of 24 hpf and 30 hpf embryos (cc: central cavity of the otic vesicle). (C) Dorsal view of the otic vesicles of a 48 hpf embryo. Arrows indicate the labeling in the posterior region of otic vesicles. (D–F) Lateral views of the left eye of 24 hpf and 48 hpf embryos, and 72 hpf larvae (l: lens). (G and H) Lateral and (I) dorsal views of the head region of 48 hpf embryos and 72 hpf larvae. Numbers indicate aortic arches 1–6. Arrow and arrowhead indicate the labeling in the heart and in the telencephalon, respectively. (J) Dorsal view of the head region of a 24 hpf embryo. Arrow indicates the midbrain–hinbrain boundary (r5: rhombomer 5). (K) Ventral view of the head region showing signal in the primary mouth. Scale bars = 50 μm for A-G and J, and 80 μm for H, I and K. EXPRESSION / LABELING:
|
Reprinted from Gene expression patterns : GEP, 11(1-2), Bretaud, S., Pagnon-Minot, A., Guillon, E., Ruggiero, F., and Le Guellec, D., Characterization of spatial and temporal expression pattern of Col15a1b during zebrafish development, 129-134, Copyright (2011) with permission from Elsevier. Full text @ Gene Expr. Patterns