
- Title
-
In vivo development of dendritic orientation in wild-type and mislocalized retinal ganglion cells
- Authors
- Choi, J.H., Law, M.Y., Chien, C.B., Link, B.A., and Wong, R.O.
- Source
- Full text @ Neural Dev.

Mature retinal ganglion cells project dendritic arbors apically toward presynaptic partners. (A) Schematic showing retinal ganglion cells (RGCs) in the adult vertebrate retina orient their arbors toward their presynaptic partners, amacrine cells (ACs) and bipolar cells (BCs). Their synaptic contacts are confined to the inner plexiform layer (IPL). RGC axons exit basally from the cell bodies before traversing along the inner limiting membrane (ILM) and exiting the eye. Ph, photoreceptors; HC, horizontal cell; OLM, outer limiting membrane. (B) RGCs were imaged from less differentiated regions of the retina (′early′) and compared to those from more differentiated regions (′late′). Less differentiated regions were distinguished from more differentiated regions by the absence or presence, respectively, of an IPL visualized in the background of Q01 transgenic animals (red; maximum projection of three optical planes centered at the RGC soma). RGCs were labeled by transient expression of isl2b:MGFP (greyscale). Dotted line, ILM. The images in the top and bottom panels were acquired at 51 hours post-fertilization (hpf) and 60 hpf, respectively. (C) Dendritic tips, neurites > 1 μm, for the examples in (B) are marked by colored dots. The horizontal line runs parallel to the ILM and crosses the approximate center of the cell body (black dot). (D) Summary of the spatial distributions of dendritic tips for the measured population (n = number of cells). Each color represents a different cell. |

In vivo time-lapse imaging showing transition of a retinal ganglion cell dendritic arbor from unoriented to apically oriented. (A) Maximum intensity projections of multiphoton image stacks of an RGC at successive time-points, beginning at 40 hpf. The arrows indicate a primary dendrite. Cell is oriented with apical direction upwards. See Additional file 1 (movie of the time-lapse). (B) Quantification of the dendritic behavior of four representative RGCs over several hours, showing progressive orientation of the dendrites towards the apical direction. Numbers at the first time-point indicate the age (hpf) of the embryo when the time-lapse commenced. Because the retina shows a centroperipheral gradient in maturation, cells at various stages of maturation can be found within an eye. |
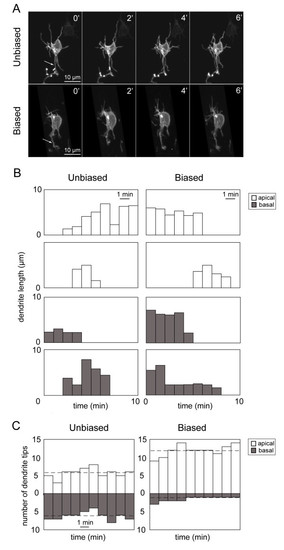
Dynamic behavior of apical and basal dendrites of developing retinal ganglion cells. (A) Example of a time-lapse recording (time elapsed in minutes) from an ′unbiased′ and a ′biased′ RGC showing extension and retraction of processes. Arrows indicate axons. (B) Examples of the dynamic behavior of individual apical dendrites (white) and basal dendrites (grey) over time showing dendritic length over time and dendritic lifetimes. Motility rates (Figure 4) of individual dendrites were calculated from such plots. (C) Examples showing how the numbers of apical and basal tips change over time (10 minutes of recording). Shown here are the plots for a cell with an unbiased arbor and a cell with a biased arbor. The dotted line indicates the average number of apical or basal dendrites of the cell during the recording period. |
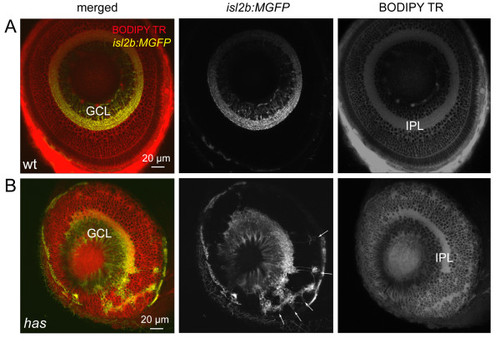
Some retinal ganglion cells are mislocalized in the has mutant. (A) Normal localization of RGCs to the ganglion cell layer (GCL) in the isl2b:MGFP line. BODIPY Texas Red (TR) labeling clearly reveals the cell body-free inner plexiform layer (IPL). Wt, wild type. (B) Distribution of RGCs in the isl2b:MGFP; has mutant retina. Arrows point to mislocalized RGCs. |
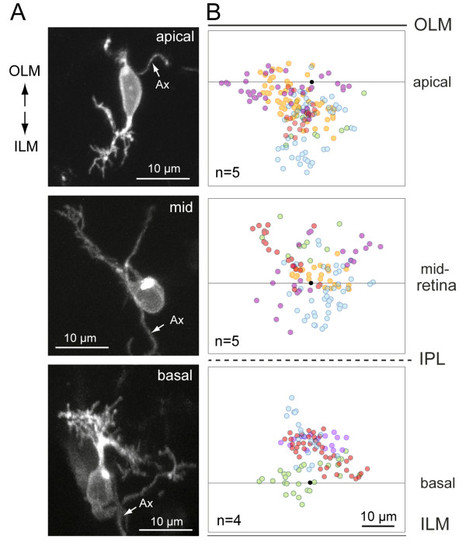
Distribution of dendritic tips in mislocalized retinal ganglion cells in the has retina. RGCs were labeled either by transient expression of isl2b:MXFP in has animals or visualized in brn3c:MGFP; has animals. Ax, axon. (A) Examples of isolated RGCs at various depths of the has retina. The cell was oriented in three dimensions as described in the Materials and methods. (B) Summary of the distributions of dendritic tips for several RGCs at the various depths. Black dots represent the center of the soma; the line through the dot is approximately parallel to the ILM or OLM. Each color represents a separate RGC. Red dots are tips from the cells shown in the left column. |
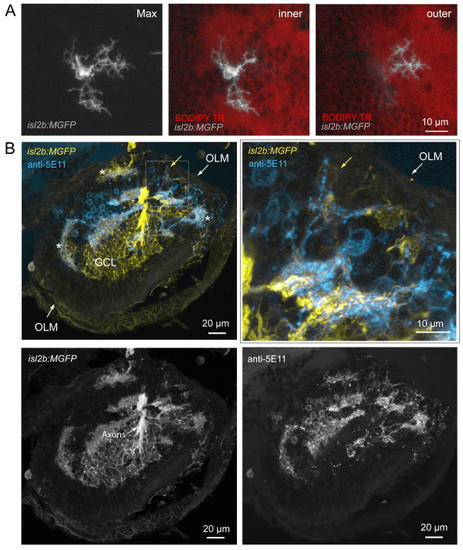
Misplaced retinal ganglion cells project dendrites towards neuropil comprising amacrine cell neurites. (A) Example of a mispositioned RGC with dendritic terminals projecting to cell body-free regions, putative neuropil, at different retinal depths (Max, maximum projection of image stack). While two arbors (inner) terminate close to the cell body (towards the ILM) within a neuropil region, one arbor projects into a deeper (towards the OLM) part of this uneven neuropil, towards the back of the eye (outer). See Additional file 6 for viewing sequential image planes of the three-dimensional reconstruction of the cell. (B) Colocalization of RGC dendrites and amacrine cell neurites also occur in ectopic locations (asterisks). RGCs are labeled by expression of GFP in the isl2b:MGFP line crossed into the has background. Amacrine cells are immunolabeled by anti-5E11 in this frozen section. Higher magnification of the boxed area shows processes of a ganglion cell (yellow arrow) colocalizing with 5E11 staining (cyan). OLM, outer limiting membrane; GCL, ganglion cell layer. |
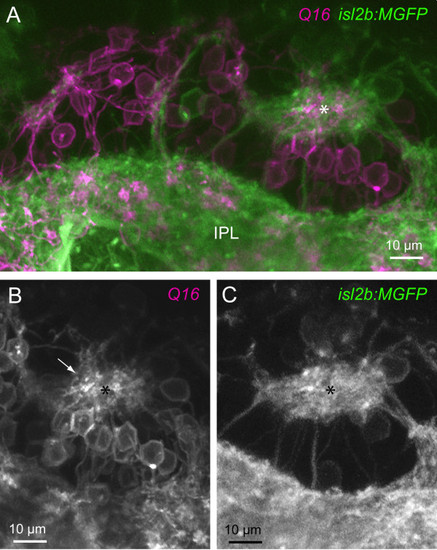
Ectopic neuropil in has mutants comprise processes of retinal ganglion cells and bipolar cells. (A) Multiphoton reconstruction of the processes of RGCs (isl2b:MGFP) and bipolar cells (Q16). An ectopic neuropil is marked by the asterisk. A continuous band of RGC and bipolar cell processes closest to the ILM is denoted here as the inner plexiform layer (IPL). (B) Bipolar cell processes (arrow) projecting to the ectopic neuropil (asterisk) are apparent. (C) The ectopic neuropil also contains processes of RGCs. |
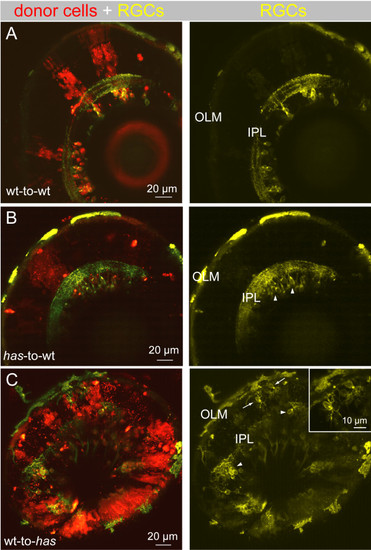
Dendritic misprojections of ectopically located retinal ganglion cells in the has mutant is non-cell autonomous. In each chimera, donor cells were labeled by a lineage tracer (red), fluororuby. Donor cells were always taken from the isl2b:MGFP line (yellow), either in a wild-type (wt) or has background, to better visualize dendrites. (A) Wild-type donor cells transplanted to a wild-type host. RGC dendritic arbors were oriented toward the OLM and stratified within an IPL. (B) has donor cells transplanted to a wild-type host. All has RGCs were located in the GCL (arrowheads). C. Wild-type donor cells transplanted to a has host. Most RGCs were located in the GCL (arrowheads), but a few cells were located ectopically (arrows). Inset shows higher magnification of the misplaced RGCs indicated by the arrows. |