
- Title
-
Optogenetic in vivo cell manipulation in KillerRed-expressing zebrafish transgenics
- Authors
- Teh, C., Chudakov, D.M., Poon, K.L., Mamedov, I.Z., Sek, J.Y., Shidlovsky, K., Lukyanov, S., and Korzh, V.
- Source
- Full text @ BMC Dev. Biol.

Expression of the membrane-tethered KillerRed in some of enhancer trap transgenic lines. (A-B) The head of SqKR1, lateral view. (B) The magnified view of the eye. (C-D) The head of SqKR2, lateral view. Mem-KR is expressed in rhombomeres 3 and 5 (r3 and r5). (D) A magnified view of the box in C. (E-F) The head of SqKR4, dorsal view. mem-KR is expressed in the optic tectum (ot) and hypothalamus (hyp). (F) A magnified view of the box in E. (G-H) The head of SqKR11, dorsal view. The habenula (ha), optic tectum (ot), hindbrain (hb) is highlighted in this projection. (H) A magnified view of the box in G enclosing the habenula. (I-J) The head of SqKR15, lateral view. (J) A magnified view of the heart, ventral view. (K-L) The head of SqKR19, lateral view. (L) Expression of mem-KR in the choroid plexus (chp) of SqKR19, dorsal view. All scale bars correspond to 100 μm, unless otherwise stated. |

Illumination of the hindbrain of SqKR2 caused bleaching of KR followed by increase in apoptosis. (A-I) Efficient photobleaching of KR was achieved by intense green light using the UV lamp of the compound microscope in widefield mode. (A-C) Fluorescent merged images of the SqKR2 embryo at various time points, before and after illumination with white light. (E-I) Fluorescent merged images of the SqKR2 embryo at various time points, before and after illumination with green light. F and H are the bright field and fluorescent merged images of E and G, respectively. (J-L) Merged fluorescent/DIC images of KR-expressing cells (green) and TUNEL-positive cells (red) in SqKR2 (J), SqKR15B (K) and wild type zebrafish embryos (L). (J, L) Embryos were double stained for TUNEL (red) and (J, K) in addition by anti-KR antibody (green). (M) When compared to illuminated controls apoptosis increased more than two-fold in the hindbrain of illuminated SqKR2. A bar chart documenting the average number of TUNEL-positive cells per embryo in 10 embryos of three illuminated groups (SqKR2, SqKR15B and WT control). Values presented as mean ± SEM. Paired T test between the illuminated SqKR2 embryos and controls showed that the difference in the average number of TUNEL-positive cells is significant (P < 0.05). P values between groups are highlighted by the enclosing brackets. |
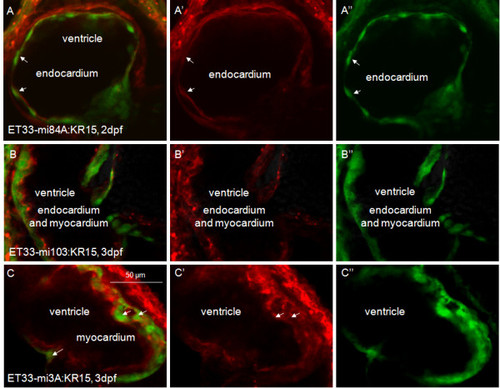
KillerRed expression in SqKR15 is present in all layers of the heart. (A) Co-localization of GFP and KR in the endocardium of the ET33-mi84A:SqKR15 double transgenic embryo (arrow - endocardium). (B) Co-localization of GFP and KR in the endocardium and myocardium of the ET33-mi103:SqKR15 double transgenic embryo. (C) Co-localization of GFP and KR in the myocardium of the ET33-mi3A:SqKR15 double transgenic embryo (arrow - myocardium). (A, B, C) merged images; (A′, B′, C′) - KR expression; (A′′, B′′, C′′) - GFP expression. EXPRESSION / LABELING:
|
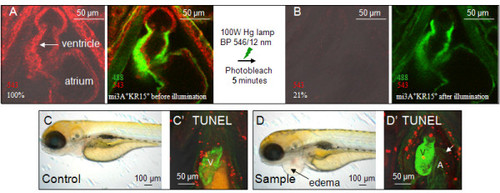
Illumination of KR-expressing heart bleaches KR and causes cardiac edema.(A-B) KR expression in the 3dpf beating heart of SqKR15 was reduced to 21% after 5 min of exposure to intense green light. (A) Expression of GFP and KR in the ET33-mi3A:SqKR15 double transgenic embryo prior to illumination and (B) after illumination. (C-D) Larvae at 4 dpf, one day after illumination: C - ET33-mi3A (control), D - ET33-mi3A:SqKR15 (experimental sample). Cardiac edema developed in ET33-mi3A:SqKR15 larvae one day after illumination (D). Apoptosis in the heart of SqKR15 is similar to that in control. EXPRESSION / LABELING:
PHENOTYPE:
|
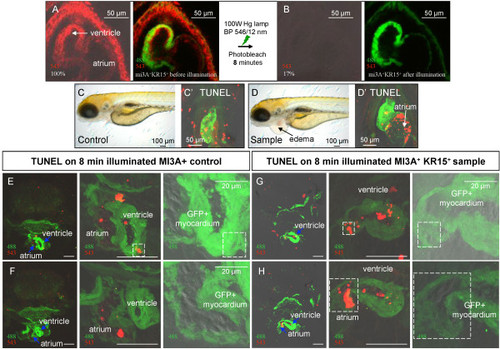
Increased illumination increased apoptosis in the KR-expressing heart. (A-B) 8 min illumination of the 3dpf heart of SqKR15 embryo with intense green light reduced fluorescence intensity to 17%. (A) GFP and SqKR15 fluorescence in the ET33-mi3A:SqKR15 double transgenic embryo before and (B) after illumination. (C-D) same larvae one day after illumination: C - ET33-mi3A (control), D - SqKR15/ET33-mi3A (sample). TUNEL (+) cells in the heart of illuminated sample (D′) and control (C′), a day after illumination. (E-F) TUNEL staining of transverse sections of SqET33-mi3A larva (control) and (G-H) SqKR15/ET33-mi3A larva (sample), at different magnification one day after illumination. Examples of TUNEL (+) cells in the myocardial layer are boxed in white. All scale bars are 50 μm in length unless otherwise stated. EXPRESSION / LABELING:
PHENOTYPE:
|
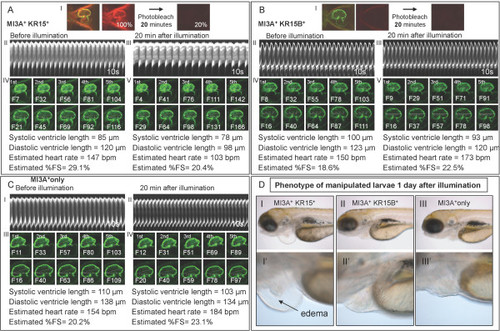
A reduction in cardiac output was observed in KR-expressing larvae immediately after illumination. (A-C) Heartbeat and contractility in SqKR15/ET33-mi3A (A), SqKR15B/ET33-mi3A (B) and KR-negative Sq ET33-mi3A (C) 3dpf larvae before illumination and 20 min after illumination. Panel (I) in (A-B) shows confocal images of corresponding double transgenic larvae, taken at the same gain setting, before and after illumination. M-modes depicting a heartbeat for 10 sec before and after illumination are in panels A-B, II-III and C, I-II. Images of five consecutive ventricular systole and diastole are shown in A-B, IV-V and C, III-IV. Cardiac output was specifically reduced after illumination of SqKR15/ET33-mi3A larva as the reduction in heartbeat is accompanied by a decrease in contractility indicated by a decrease in value of %FS. (D) Larvae at 4dpf, one day after illumination: (I) - SqKR15/ET33-mi3A (sample), (II) - SqKR15B/ET33-mi3A with skin mem-KR expression as a positive control and (III) - SqET33-mi3A as a negative control. Only SqKR15/ET33-mi3 developed prominent cardiac edema next day after illumination [D (I-I′)]. PHENOTYPE:
|

ZFIN is incorporating published figure images and captions as part of an ongoing project. Figures from some publications have not yet been curated, or are not available for display because of copyright restrictions. PHENOTYPE:
|
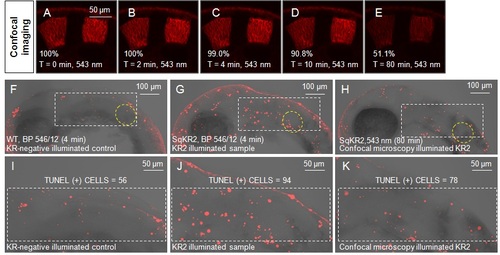
Illumination by the confocal microscope laser is inefficient in causing apoptosis. (A-E) Changes in fluorescence intensity of SqKR2 embryo during 80 minutes of continuous confocal imaging. (F-K) Illumination by green light of mercury lamp in the widefield mode increases apoptosis in the hindbrain of the SqKR2 embryo (G, J). Relatively few apoptotic cells in the SqKR2 embryo were detected following continuous confocal imaging (H, K). The otic vesicle is defined by yellow broken line (Figure 2F-H). |
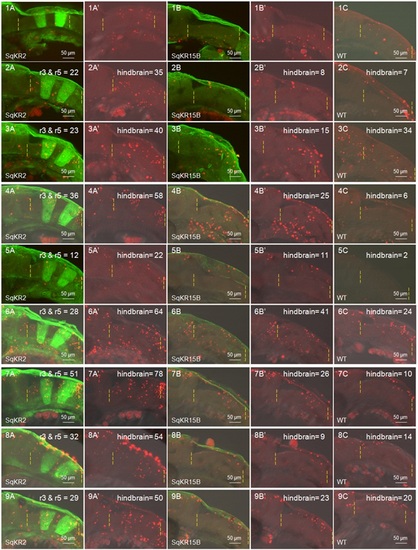
Compilation of TUNEL staining data used to generate the bar chart for apoptosis in the hindbrain. (1-9A) Merged fluorescent/DIC images of KR expressing cells (green) and TUNEL-positive cells (red) in SqKR2 (A), Sq15B (1-9B) and wild type zebrafish embryos (1-9C). TUNEL-positive cells in each data set were quantified using the count tool in Adobe Photoshop CS4. |
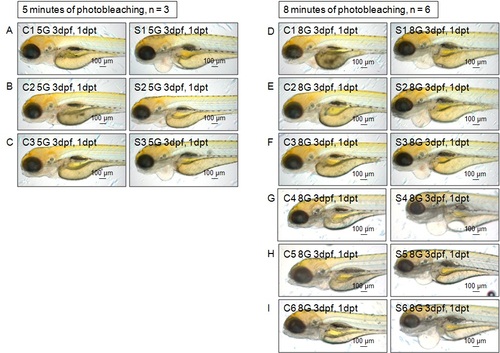
Compilation of images of all illuminated SqKR15 larvae with pericardial edema a day after illumination. |

First group of images used to generate the bar chart of percent change in heartbeat and contractility after illumination. Heart beat and contractility in SqKR15/ET33-mi3A (sample), SqKR15B/ET33-mi3A (skin control) and KR-negative Sq ET33-mi3A (negative control) 3dpf larvae before and 20 min after illumination. |

Second group of images used to generate the bar chart of percent change in heartbeat and contractility after illumination. Heart beat and contractility in SqKR15/ET33-mi3A (sample), SqKR15B/ET33-mi3A (skin control) and KR-negative Sq ET33-mi3A (negative control) 3dpf larvae before and 20 min after illumination. |

Third group of images used to generate the bar chart of percent change in heartbeat and contractility after illumination. Heart beat and contractility in SqKR15/ET33-mi3A (sample), SqKR15B/ET33-mi3A (skin control) and KR-negative Sq ET33-mi3A (negative control) 3dpf larvae before and 20 min after illumination. |
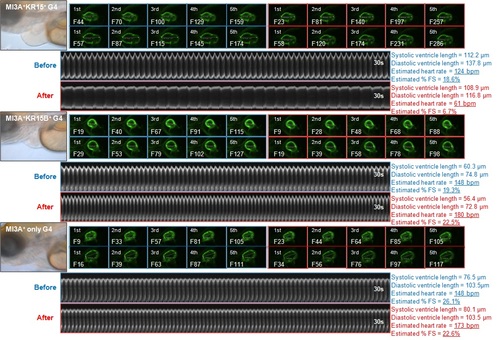
Fourth group of images used to generate the bar chart of percent change in heartbeat and contractility after illumination. Heart beat and contractility in SqKR15/ET33-mi3A (sample), SqKR15B/ET33-mi3A (skin control) and KR-negative Sq ET33-mi3A (negative control) 3dpf larvae before and 20 min after illumination. |