
- Title
-
Zebrafish eve1 regulates the lateral and ventral fates of mesodermal progenitor cells at the onset of gastrulation
- Authors
- Seebald, J.L., and Szeto, D.P.
- Source
- Full text @ Dev. Biol.
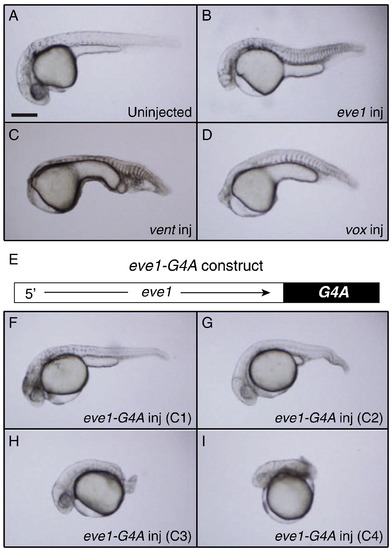
Morphological phenotype comparison between zebrafish embryos overexpressing eve1, vent, vox and eve1-G4A. A–D) Lateral views of embryos at 24 h post fertilization (hpf) with anterior to the left. A) Uninjected (n = 30), B) Injected with 90 pg of eve1 mRNA (n = 66), C) Injected with 75 pg of vent mRNA (n = 58) and D) Injected with 75 pg of vox mRNA (n = 72). E) Schematic depiction of eve1-G4A construct. F–I) Lateral views of embryos injected with 100 pg of eve1-G4A at 24 hpf with anterior to the left, showing a range of dorsalized phenotypes F) C1 (n = 1/43), G) C2 (n = 16/43), H) C3 (n = 19/43) and I) C4 (n = 7/43). Scale bar, 200 μm. |
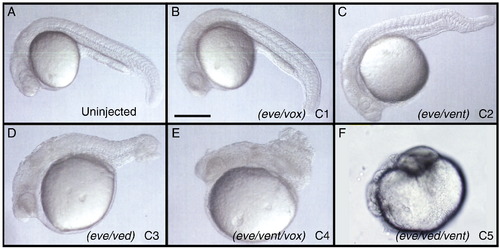
Range of dorsalized phenotypes from embryos injected with double or triple combinations of morpholinos against eve1, ved, vent and vox. A–F) Lateral views of embryos at 24 hpf with anterior to the left. A) Uninjected, B) C1 dorsalized phenotype of eve/vox morphant, C) C2 dorsalized phenotype of eve/vent morphant, D) C3 dorsalized phenotype of eve/ved morphant, E) C4 dorsalized phenotype of eve/vent/vox morphant, and F) C5 dosalized phenotype of eve/ved/vent morphant. Scale bar, 200 μm. PHENOTYPE:
|
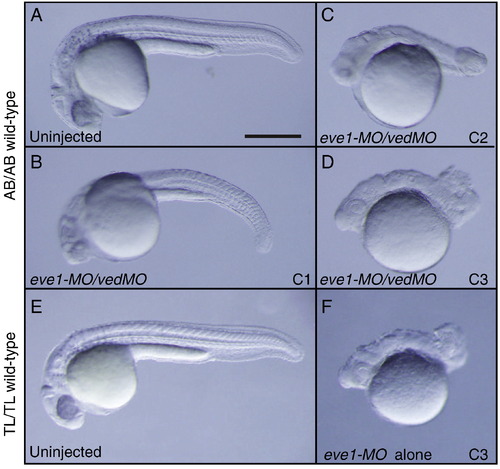
Morphological phenotype comparison between AB/AB and TL/TL wild-type zebrafish embryos injected with eve1-MO and eve1-MO/vedMO. A–F) Lateral views of embryos at 24 h post fertilization (hpf) with anterior to the left. A) Uninjected AB/AB wild-type (n = 35/35), B) C1 phenotype of AB/AB embryos injected with 6 ng of eve1-MO and 8 ng of vedMO (n = 9/100), C) C2 phenotype of AB/AB embryos injected with eve1-MO/vedMO (n = 20/100). D) C3 phenotype injected with eve1-MO/vedMO (n = 71/100). E) Uninjected TL/TL wild-type. F) C3 phenotype of TL/TL embryos injected with 6 ng of eve1-MO alone (n = 25/42). Scale bar, 200 μm. PHENOTYPE:
|

Whole-mount in situ hybridization of TL/TL embryo injected with eve1-MO and AB/AB embryo injected with eve1-MO/vedMO using tbx24 probe. A–D) Animal pole views of embryos at 6 hpf with dorsal to the right. A–B) tbx24 expression is normal in TL/TL uninjected wild-type embryo (n = 25/25) as indicated by black arrows (A), and ventrally expanded in TL/TL wild-type embryo (n = 20/30) injected with eve1-MO alone as indicated by black arrowhead (B). C–D) tbx24 expression is normal in AB/AB wild-type embryo injected with eve1-MO alone (n = 35/35) as indicated by black arrows (C), and ventrally expanded in AB/AB wild-type embryo (n = 20/30) injected with eve1-MO/vedMO as indicated by black arrowhead (D). Scale bar, 200 μm. |
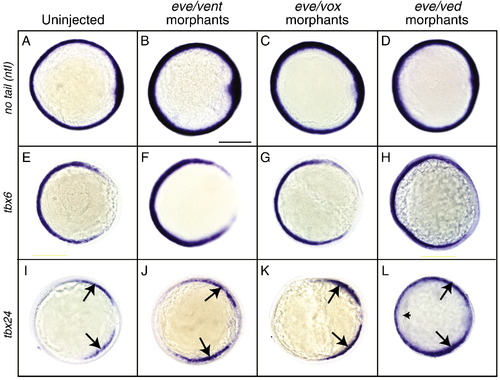
Whole-mount in situ hybridization using no tail (ntl), tbx6 and tbx24 probes. A–L) Animal pole views of embryos at 6 hpf with dorsal to the right. A–D) ntl expression is normal in uninjected (A) (n = 36/36), eve/vent morphant (B) (n = 30/30), eve/vox morphant (C) (n = 22/22), and eve/ved morphant (D) (n = 43/43). E–H) tbx6 expression is normal in uninjected (E) (n = 20/20), eve/vent morphant (F) (n = 105/113), eve/vox morphant (G) (n = 77/93), and eve/ved morphant (H) (n = 75/76). I–L) tbx24 expression is normal in uninjected (I) (n = 27/27), eve/vent morphant (J) (n = 64/70), eve/vox morphant (K) (n = 66/68), but is expanded in eve/ved morphant (L) (n = 99/130). Black arrows indicate the normal bilateral tbx24 expression in MPCs. Black arrowhead indicates the expanded ventral expression of tbx24. Scale bar, 200 μm. |
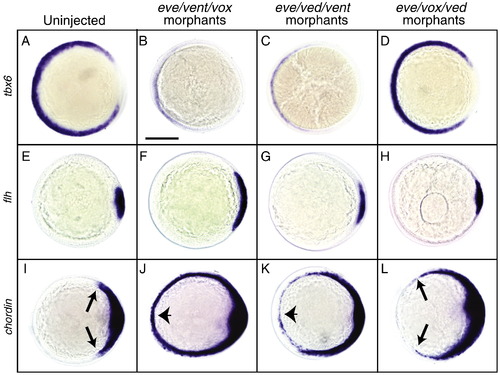
Whole-mount in situ hybridization using tbx6, floating head (flh) and chordin probes. A–L) Animal pole views of embryos at 6 hpf with dorsal to the right. A–D) tbx6 expression is normal in uninjected (A) (n = 28/28), dramatically reduced in eve/vent/vox morphant (B) (n = 65/86), substantially decreased in eve/ved/vent morphant (C) (n = 45/68), and not significantly affected in eve/vox/ved morphant (D) (n = 71/74). E–H) flh expression of uninjected (E) (n = 31/31), eve/vent/vox morphant (F) (n = 45/47), eve/ved/vent morphant (G) (n = 38/40), and eve/vox/ved morphant (H) (n = 32/35). I–L) chordin expression of uninjected (I) (n = 24/24), eve/vent/vox morphant (J) (n = 68/68), eve/ved/vent morphant (K) (n = 67/68), and eve/vox/ved morphant (L) (n = 28/28). Arrows indicate the ventral limit of chordin expression in wild-type (I) and eve/vox/ved morphant (L). Arrowheads indicate ventrally expanded chordin expression in eve/vent/vox (J) and eve/ved/vent (K) morphant embryos. Scale bar, 200 μm. |

Characterization of ectopic tail phenotypes of eve/ved morphant embryos by whole-mount in situ hybridization and morphological observation. A and B) Dorsal views with anterior to the left, showing myoD expression is normal in uninjected (A) (n = 15/15) and laterally expanded in eve/ved morphant (B) embryos at 10hpf (n = 23/25). C and D) Lateral views with anterior to the left, showing the ntl expression is normal in uninjected (C) (n = 18/18) and at an ectopic location (black arrow) in eve/ved morphant (D) embryos at 18 hpf (n = 10/50). E–H) Lateral views with anterior to the left, showing the tail (posterior body) of uninjected (E) and primary and secondary tails (black arrows) of eve/ved morphant (F) at 24 hpf (n = 9/50). G and H) Normal tail (posterior body) formation of uninjected (G) and ectopic tail formation of eve/ved morphant (H) embryos at 48 hpf. Scale bar, 200 μm. EXPRESSION / LABELING:
PHENOTYPE:
|
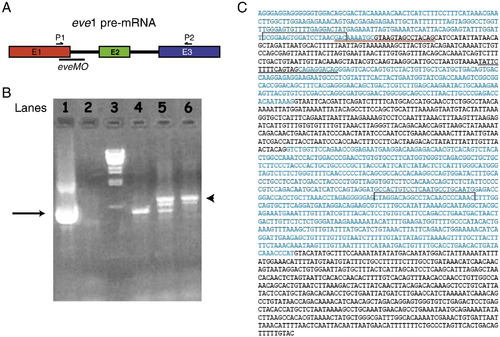
Analysis of eve1 transcripts from uninjected and eveMO injected embryos at 6 hpf by RT-PCR. A) Schematic illustration of the eve1 pre-mRNA and the locations of designed eve1-specific splice blocking morpholino (eveMO) as well as the positions of primers used for the RT-PCR reactions. B) A 1.0% agarose gel with PCR products from various conditions. Lane 1) eve1 cDNA template used as positive control. Lane 2) No eve1 cDNA added as negative control. Lane 3) Lambda DNA markers, Lane 4) RT-template from uninjected embryos at 6 hpf. Lane 5) RT-template from embryos injected with 10 ng eveMO. Lane 6) RT-template from embryos injected with 25 ng eveMO. Black arrow indicates the expected normal PCR product of 674-bp. Arrowhead indicates the longer PCR product of 895-bp that contains the sequence of intron 1. C) Exon and intron sequences of the eve1 gene. Exon sequences are indicated in blue letters and intron sequences are indicated in black letters. Red line is used to indicate the location of eveMO blocking exon1 and intron 1 junction. Black line is used to indicate the location of eve1-MO blocking intron 1 and exon 2 junction. Black brackets indicate the location of primers that are used for RT-PCR experiments. |
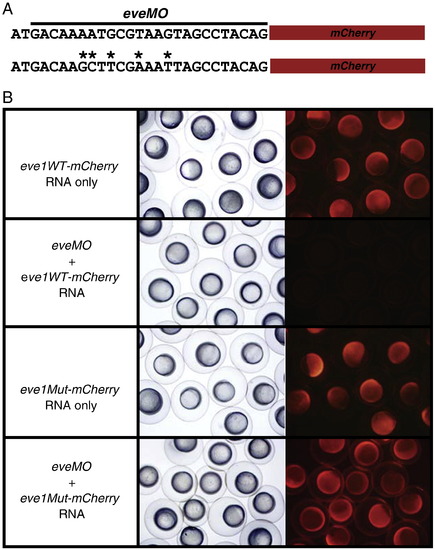
Determination of targeting specificity of eveMO. A) Target sequences of eveMO wild-type (top) and eveMO mutant (bottom) were placed in front of mCherry and cloned into pCS2+ vector. The black line indicates the binding location of eveMO. B) In vitro transcribed eve1WT-mCherry and eve1Mut-mCherry mRNAs were injected either alone or with eveMO into one-cell stage embryos. Bright field and fluorescent images of injected embryos at 6 hpf are shown. Note that eveMO is unable to block the translation of eve1Mut-mCherry mRNAs. |
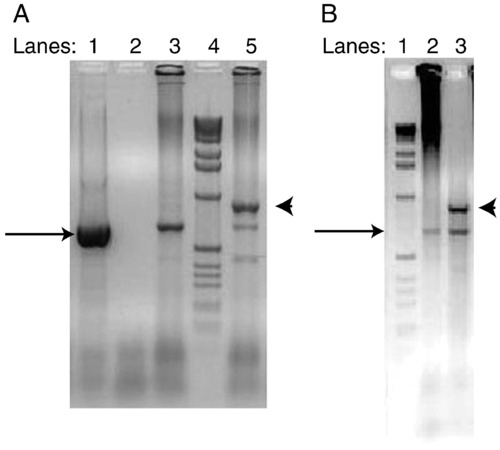
Analysis of eve1 transcripts from uninjected and eve1-MO alone injected AB/AB and TL/TL wild-type embryos at 6 hpf by RT-PCR. A Lane 1) eve1 cDNA template used as positive control. A Lane 2) No template as negative control. A Lane 3) RT-template from uninjected AB/AB wild-type embryos. A Lane 4) l.0-kb DNA markers. A Lane 5) RT-template from AB/AB embryos injected with 6 ng eve1-MO. B Lane 1) l.0-kb DNA markers. B Lane 2) RT-template from uninjected TL/TL wild-type embryos. B Lane 3) RT-template from TL/TL embryos injected with 6 ng eve1-MO. Black arrow indicates the expected normal PCR product of 674-bp. Arrowhead indicates the longer PCR product of 895-bp that contains the sequence of intron 1. |
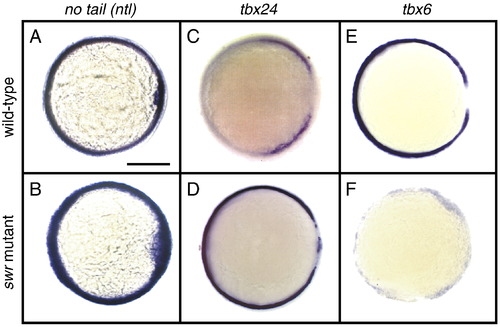
Expression of tbx6, tbx24 and ntl in wild-type and swr/bmp2b mutant embryos at the shield stage. A–F) Animal views with dorsal to the right. A–B) ntl expression of wild-type A) and swr/bmp2b mutant B) embryos. C–D) tbx24 expression of wild-type C) and swr/bmp2b mutant D) embryos. E–F) tbx6 expression of wild-type E) and swr/bmp2b mutant F) embryos. Scale bar, 200 μm. |
Reprinted from Developmental Biology, 349(1), Seebald, J.L., and Szeto, D.P., Zebrafish eve1 regulates the lateral and ventral fates of mesodermal progenitor cells at the onset of gastrulation, 78-89, Copyright (2011) with permission from Elsevier. Full text @ Dev. Biol.