
- Title
-
Cellular differentiation in primary cell cultures from single zebrafish embryos as a model for the study of myogenesis
- Authors
- Myhre, J.L., and Pilgrim, D.B.
- Source
- Full text @ Zebrafish
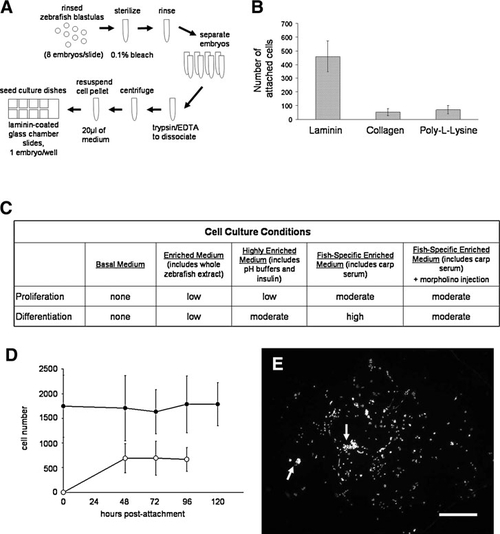
Optimal substrates and media for single-embryo zebrafish embryonic blastomere (seZEB) culture. (A) Schematic depiction of the single-embryo culture method, from embryo collection to seeding of culture slides. (B) Substrates were tested for optimal cell attachment and subsequent differentiation of ZEB cultures, including 25 μg/mL laminin, bulk rat-tail collagen, and 0.1mg/mL poly-L-lysine, as assessed by total cell count after 24 h of culture (n=24 single-embryo cultures per treatment). (C) Cell culture media were tested to determine qualitative effects on proliferation and cellular differentiation. Cell proliferation was assessed by total cell count after 4 days of culture, and differentiation was assessed by the presence or absence of morphologically distinguishable myocytes. Relative density of myocytes indicated low, medium, or high rate of differentiation (n=40–64 cultures examined per treatment). (D) Cell proliferation in highly enriched media was sufficient to overcome initial cell death after bleaching of embryos, as determined by counts of adherent cells after DAPI staining (black circles). The percentage of differentiated cells was determined by actin costaining (open circles), n=24 cultures. (E) A representative spot culture stained with DAPI to show the distribution of cell nuclei after differentiation. Arrows indicate clusters of differentiated myocytes. Scale bar=1 mm. |
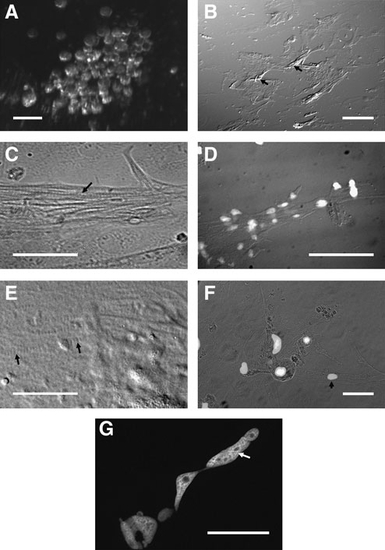
Phenotypic characterization of seZEB cultures. Single-embryo zebrafish cell cultures were established on eight-well chamber slides. (A) Live embryonic blastomeres from a single zebrafish embryo at the time of initial plating, imaged using a stereo dissecting microscope (scale bar = 0.1 mm). (B) Differential interference contrast microscopy of a single-embryo culture at low magnification (40x). Scale bar = 1mm. Arrows indicate piled-up regions of differentiating myocytes. (C–G) Differential interference contrast microscopy of differentiated myocytes in single-embryo cultures. Nuclei are indicated by DAPI staining in D and F (scale bars = 0.1mm). Arrows highlight the periodic banding pattern characteristic of striated muscle cells in panels C and E (scale bars = 0.05 mm). Arrowhead in F indicates an isolated, single-nucleated myocyte. (G) DAPI-stained single myocyte, demonstrating multiple and elongated nuclei (arrow). Scale bar = 0.05mm. |
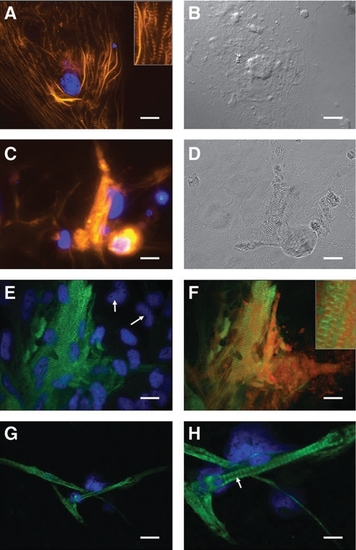
Molecular characterization of cells derived from seZEB cultures. Single-embryo cultures were stained for several markers of myocyte differentiation. Actin expression in seZEB cultures is shown by Alexa 546-phalloidin staining (A, C) (orange), whereas nuclei are indicated by DAPI staining (blue). Single-nucleated myocytes (A, inset) and multinucleated myocyte bundles (C) both demonstrate distinct banded patterns of actin expression. (B, D) Phase-contrast images of the stained cultures from A and C, demonstrating a single cell body (A) versus a bundle of elongated cells (C). (E) Muscle myosin was detected using F-59 anti-myosin heavy chain antibody and Alexa 488 anti-mouse secondary antibody (green), with DAPI counterstain (blue). Myosin-negative cells are indicated with arrows. (F) Myosin and actin costained cultures, showing alternating patterns of myosin and actin sarcomere bands characteristic of differentiating muscle. Higher magnification is shown in the inset. Comparison with cultures of differentiated tail myocytes from 3-day-old zebrafish embryos demonstrated a similar phenotype (G) and pattern of muscle myosin expression (H) in characteristic M-bands (arrow). Scale bars = 0.05mm (A–H) and 0.1mm (G). |

Expression of transgenic markers in seZEB cultures. Single-embryo cell cultures were established using embryos from unc45b-GFP or fli1-GFP transgenic zebrafish, which fluoresce in muscle tissue and endothelial tissue, respectively. (A, B)) Expression of unc45b-GFP was limited to bundles of differentiating myocytes, while isolated cells (indicated by DAPI staining) at the edges of the culture (A) or between the myocyte bundles (B) displayed no detectable GFP (arrows). (C) Actin staining with Alexa 568 phalloidin revealed that GFP-positive cells also displayed actin banding patterns characteristic of myocytes (arrow). Inset shows higher magnification. (D) Expression of fli1-GFP was not detected in any culture, although differentiating cells still appeared flattened and elongated like wild-type (WT) cultures under phase-contrast microscopy (E). All cultures examined contained visibly differentiating myocytes which were positive for unc45b-GFP expression (n = 40 single-embryo cultures). Scale bars in all panels = 0.1mm. |
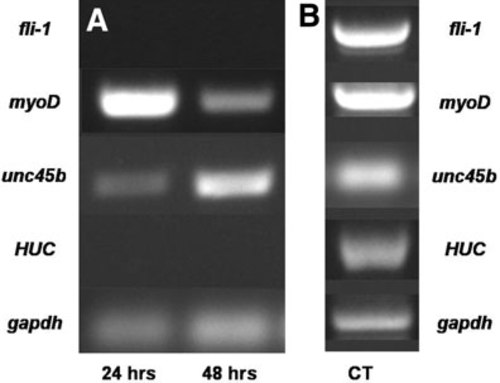
Expression of markers for endothelial, neuronal, and myogenic differentiation in ZEB cultures. ZEB cultures derived from multiple WT embryos were established and collected at 24-h intervals to obtain RNA for analysis by RTpolymerase chain reaction (PCR). (A) Detection by RT-PCR of endothelial (top row), myogenic (second and third row), and neuronal (fourth row) marker transcript expression. No fli1 (endothelial) or HUC (neuronal) marker transcription was detected in optimized ZEB cultures, whereas myoD and unc45b (muscle) transcripts were detected throughout the 2 days of culture. gapdh (fifth row) served as a positive control. (B) Control RT-PCR used bulk RNA prepared from combined embryos from 4 h to 3 days postfertilization. |
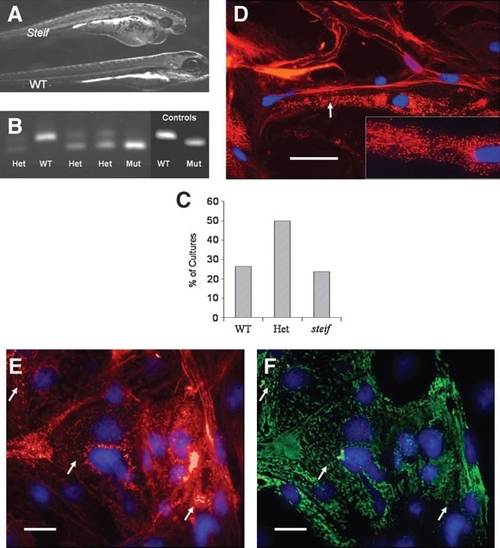
Marker expression and genotyping of seZEB cultures from unc45b mutant embryos. Single- embryo cultures of ZEB cells were established from embryos obtained by crossing steif mutant heterozygote parents. (A) Phenotype of 3-day-old steif mutant embryo as compared to WT (bottom), demonstrating heart edema and reduced birefringence of tail muscle. Cell cultures from mutant embryos were identified by dCAPS genotyping of culture media (B), compared to control DNA amplified from phenotypically identified mutant embryos or WT adults. steif alleles detected in cultured embryos gave the expected 1:2:1 ratio of homozygous WT, heterozygous, and homozygous mutants (C, n = 88). Genotype-confirmed mutant seZEB cultures were stained for actin with Alexa 568 phalloidin (D) to observe sarcomere banding patterns (red), with DAPI as a nuclear counterstain (blue). Inset shows higher magnification. Mutant cultures demonstrated deficiencies in sarcomere organization and punctate expression of actin (arrow in D). (E, F) Costaining of actin (red) with the F59 anti-myosin antibody detected by Alexa 488 anti-mouse (green) demonstrated colocalization of disorganized, punctate actin and myosin expression (arrows). Scale bars in all panels = 0.1mm. |
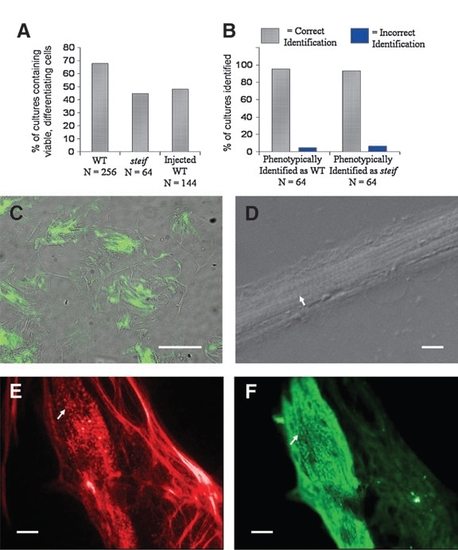
Microinjection of embryos with antisense morpholino-oligonucleotides or gene expression constructs followed by seZEB culture. The percentage of cultures with viable, differentiating cells was measured for genotyped WT, steif, and injected embryos (A). In the reverse experiment, phenotypic identification of steif mutants and WT embryos was confirmed by dCAPS genotyping, demonstrating nearly 100% accuracy (B). Only a few cultures identified phenotypically as derived from WT/heterozygous or mutant embryos were found to be otherwise. (C) Zebrafish embryos were injected at the 2- to 4-cell stage with unc45b-GFP expression constructs. GFP expression was detectable in bundles of differentiating cells as early as 2 days of culture (scale bar = 0.5 mm). (D) Blastomeres from embryos injected with p53 control morpholinos were able to undergo attachment and differentiation in culture, resulting in the formation of bundled myocytes with visible striations (arrow, scale bar = 0.05 mm). (E, F) Embryos injected with a morpholino against unc45b were costained with Alexa 568 phalloidin (E, red) and F59 anti-myosin antibody detected by Alexa 488 anti-mouse (F, green). The punctate pattern of actin and myosin expression seen in steif mutant cultures was reproduced in nearly all cultures from unc45b morpholino-oligonucleotide-injected embryos (arrows). Scale bars (E, F) = 0.1mm. |