
- Title
-
Duplicate dmbx1 genes regulate progenitor cell cycle and differentiation during zebrafish midbrain and retinal development
- Authors
- Wong, L., Weadick, C.J., Kuo, C., Chang, B.S., and Tropepe, V.
- Source
- Full text @ BMC Dev. Biol.

Spatiotemporal expression patterns of dmbx1a and dmbx1b at 72 hpf and 96 hpf. Lateral view, anterior to the left (A, C, I, K); dorsal view, anterior to the top (B, D, J, L). Coronal plastic sections (~1 μm; dorsal to the top) of the retina (E, G, M, O) and midbrain (F, H, N, P) were obtained after whole mount labeling with RNA probes. White dotted line in B and D define the position of the representative coronal plastic section shown in F and H, respectively. White dotted line in J and L define the position of the representative coronal plastic section shown in N and P, respectively. White arrow in B, D, J, L demarcates the rostrolateral region of the hindbrain (where the EG is located), and red arrow demarcates the expression in the medulla oblongata. Black arrows in E, M and O point to the INL (inner nuclear layer). The optic tectum (TeO) is demarcated by dotted lines in F, H, N, P and the region of the tegmentum (T) lies just ventral to the TeO. The position of the lens is denoted in E, G, M, O. hpf, hours post-fertilization. EXPRESSION / LABELING:
|
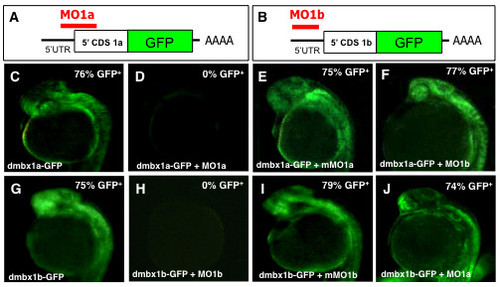
Specificity of morpholino induced dmbx1a and dmbx1b knockdown using fusion protein constructs Dmbx1a-GFP and Dmbx1b-GFP. (A, B) Schematic diagrams showing sequence of fusion constructs: 5′ UTR (black horizontal line); 5′ end of the CDS for either dmbx1a or dmbx1b (white box), the full-length coding sequence for GFP (green box); site of polyadenylation (AAAA); relative position binding sites (red horizontal line) where the MOs block translation of the fusion proteins. (C-J) dmbx1a- and dmbx1b-GFP mRNA was either injected alone or co-injected with MOs as indicated at the bottom left of each panel, and embryos were examined for the presence of GFP fluorescence at 24 hpf (lateral view with anterior to the left). The percentage of GFP positive embryos is shown on the top right. UTR, untranslated region; CDS, coding sequence; MO, morpholino; mMO, mismatch morpholino; GFP, green fluorescent protein; hpf, hours post-fertilization. |
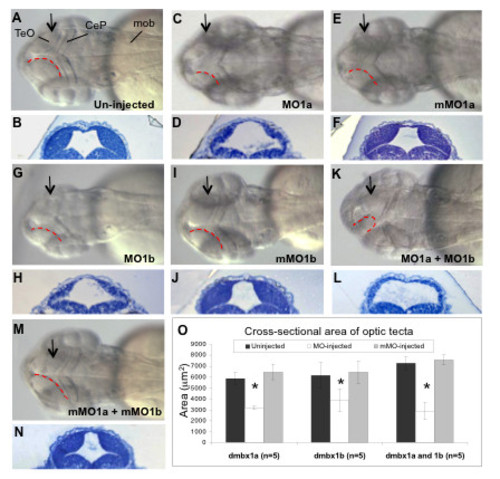
Hypoplasia of the optic tectum in dmbx1 morphants at 48 hpf. Gross morphologies of the optic tecta were compared between morphants (C, G, K) and both the un-injected (A) and mMO-injected (E, I, M) embryos. Dorsal view, anterior to the left. Contour of the medial-posterior ridge of the optic tectum is demarcated by red doted lines. The MOs used in each group are shown on the bottom right of the panel. Arrows in A, C, E, G, I, K, M represent the relative position where ~ 1 μm plastic sections were obtained as depicted in B, D, F, H, J, L, N, respectively. Measurements of the cross-sectional tectal area are summarized in the graph (O). Asterisk indicates significant difference (p < 0.05) between the morphant samples and the controls. TeO, optic tectum; CeP, cerebellar plate; mob, medulla oblongata; MO, morpholino; mMO, mismatch morpholino. PHENOTYPE:
|
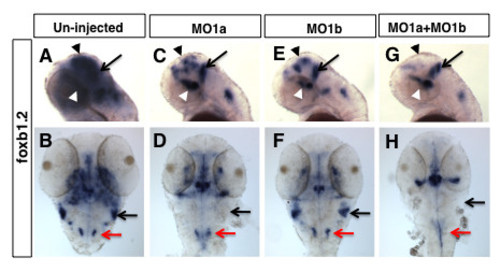
Distinct patterns of hindbrain foxb1.2 expression in dmbx1a and dmbx1b morphant embryos. Lateral view anterior to the left (A, C, E, G) and dorsal view anterior to the top (B, D, F, H) of 48 hpf embryos un-injected (A, B), or injected with MO1a (C, D), MO1b (E, F) or MO1a + MO1b (G, H). The mismatch control injected morpholinos resembled the un-injected controls and are not shown. (A, C, E, G) Black arrow indicates the position of the MHB, white arrowhead demarcates the position of the ventral diencephalic/hypothalamic region of the forebrain, and black arrowhead demarcate expression domain in the region of optic tectum. Black arrow in B, D, F, H demarcates the region of the rostrolateral hindbrain (where EG is located), and red arrow demarcates the expression in the medulla oblongata. MO, morpholino; MHB, midbrain-hindbrain boundary; hpf, hours post-fertilization EXPRESSION / LABELING:
|
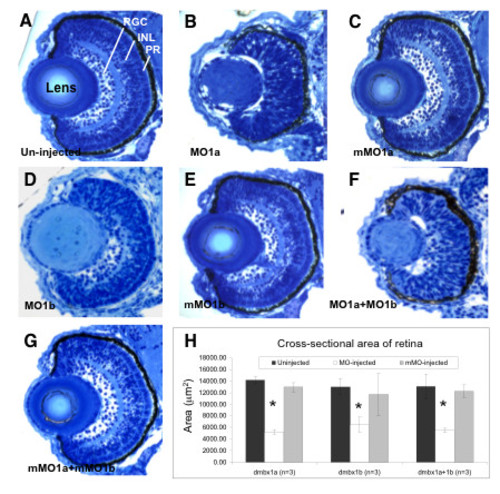
Retinal hypoplasia in dmbx1 morphants at 72 hpf. Coronal plastic sections (~ 1 μm) of retina from un-injected (A), MO-injected (B, D, F), and mMO-injected (C, E, G) embryos. Layers in the retina can be clearly distinguishable at this stage: retinal ganglion cell layer (RGC), inner nuclear layer (INL), and photoreceptor layer (PR). Measurements of the retinal cross-sectional area summarized in the graph (H). Asterisk indicates significant difference (p < 0.05) between the morphant samples and the controls. MO, morpholino; mMO, mismatch morpholino. PHENOTYPE:
|
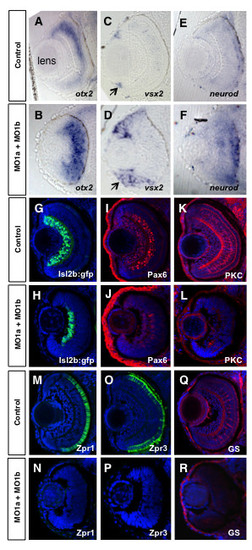
Altered retinal gene expression in morphant embryos. Coronal plastic sections (~ 1 μm) of retina at 72 hpf after whole mount in situ hybridization labeling for progenitor markers from control mMO1a + mMO1b injected (A, C, E), or MO1a + MO1b injected (B, D, F) embryos. Position of the lens (shown in A) is similar for all panels. Arrows in C and D demarcate the ciliary marginal zone (CMZ). Cryosections (~15 μm) of control (G, I, K, M, O, Q) and MO1a + MO1b (H, J, L, N, P, R) embryos immunolabelled with antibodies for indicated differentiation markers (red or green) and counter-stained with DAPI (blue). MO, morpholino. EXPRESSION / LABELING:
PHENOTYPE:
|
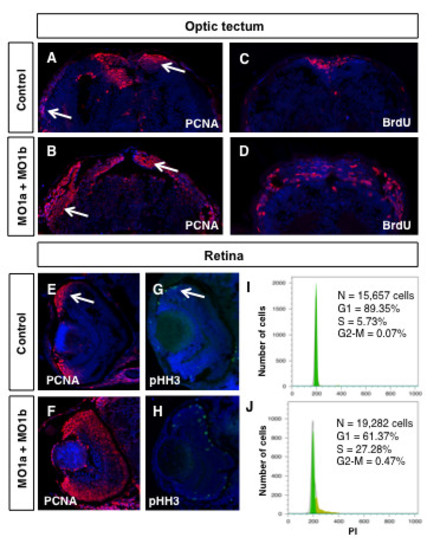
Proliferation defects in dmbx1 morphant embryos. Embryos at 72 hpf were examined for the presence of proliferating cells using immunohistochemistry with antibodies to PCNA, pHH3 or BrdU (30 min survival). Coronal (~15 μm) sections of midbrain (A-D, dorsal to the top) and retina (E-H, dorsal to the top, lens to the left). Arrow in A and B demarcates the proliferative zones of the dorsal and lateral TeO. Arrow in E and G demarcates the CMZ. (I, J) Flow cytometric analysis of retinal cells derived from un-injected or MO1a + MO1b injected embryos at 72 hpf using propidium iodide labeling. N, total number of cells analyzed; G1, gap-1 phase of the cell cycle; S, synthesis phase of the cell cycle; G2, gap-2 phase of the cell cycle; MO, morpholino; mMO, mismatch morpholino; hpf, hours post-fertilization. PHENOTYPE:
|
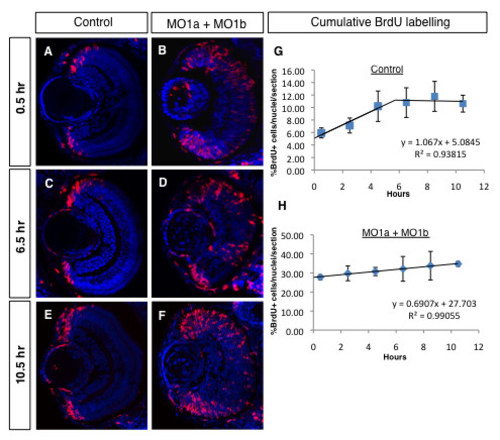
Cumulative BrdU labelling reveals an increase in the morphant progenitor cell cycle in the 72 hpf retina. (A-F) Immunolabelled coronal sections (dorsal to the top, lens to the left) from embryos repeatedly injected with BrdU (red) after different survival times (indicated on the left). Sections were counter-stained with DAPI (blue). (G, H) Regression analyses from cumulative labelling data. MO, morpholino; hpf, hours post-fertilization, hr, hours. PHENOTYPE:
|

Figure 9. Rescue of the midbrain and retinal phenotype in morphants is species-specific. The expression domain of foxb1.2 in un-injected 48 hpf embryos (A) and rho in un-injected 72 hpf embryos (E) is significantly reduced in the MO1a injected embryos (B, F). Co-injection of zebrafish dmbx1a significantly rescues these phenotypes (C, G), whereas co-injection of mouse Dmbx1 mRNA does not (D, H). Arrow in A-D demarcates the region of the rostrolateral hindbrain (where the EG is located) at 48 hpf. For A-D, images represent dorsal views, anterior to the top. For E-H, images represent ventral views, anterior to the top. MO, morpholino; hpf, hours post-fertilization. Asterisk in (C) demonstrates ectopic foxb1.2 expression, which was commonly observed in embryos over-expressed with zebrafish dmbx1a, but not mouse Dmbx1 mRNA. |
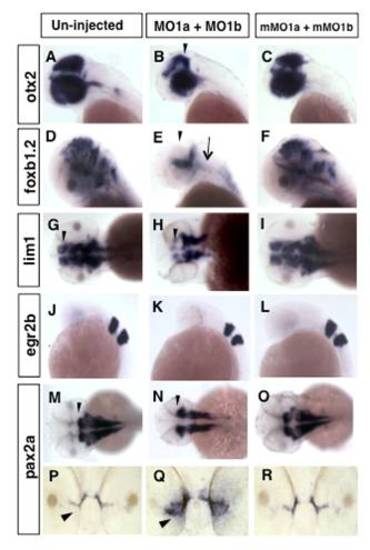
Altered midbrain gene expression in morphant embryos. Lateral (A-F, J-L) and dorsal (G-I, M-O) views anterior to the left, or anterior views (P-R) dorsal to the top of embryos either un-injected (A, D, G, J, M, P) or injected with MO1a + MO1b (B, E, H, K, N, Q) or control mMO1a + mMO1b (C, F, I, L, O, R). All embryos are at 48 hpf, except for J-L, which are at 24 hpf. Arrowhead in B and E indicates the reduced expression in the dorsal midbrain and arrow in E indicates reduced expression in the hindbrain. Arrowhead in G, H and M, N demarcates the position of the MHB. Arrowhead in P, Q indicates the optic stalk region. MO, morpholino; mMO, mismatch morpholino; MHB, midbrain-hindbrain boundary; hpf, hours post-fertilization. |

Midbrain-hindbrain boundary is unaffected in dmbx1 morphants. Lateral view (anterior to the left) of embryos at 24 hpf (A-F, M-O) or 48 hpf (G-L). Analysis of genes normally expressed in the midbrain-hindbrain boundary region in un-injected (A, D, G, J, M), MO1a + MO1b injected (B, E, H, K, N), and mMO1a + mMO1b injected (C, F, I, L, O) embryos. Arrowheads demarcate the position of the midbrain-hindbrain boundary. MO, morpholino; mMO, mismatch morpholino; hpf, hours post-fertilization. |

Dose-dependent changes in foxb1.2 and rhodopsin gene expression in dmbx1 morphants. Analysis of gene expression at 72 hpf in un-injected, MO1a injected, MO1b injected or MO1a + MO1b injected embryos using the MO concentrations listed. For foxb1.2 expression, embryos are shown in lateral view with anterior to the left. For rhodopsin expression, embryos are shown in ventral view, anterior to the left. Control embryos injected with mismatch MOs at similar concentrations showed no change in expression and are not shown. MO, morpholino; hpf, hours post-fertilization |

Distinct patterns of rhodopsin expression and retinotectal projections in dmbx1a and dmbx1b morphant embryos. Dorsal view anterior to the top of un-injected (A, B), MO1a injected (C, D), MO1b injected (E, F), and MO1a + MO1b injected (G, H) embryos demonstrating expression of rhodopsin (rho) (A, C, E, G) or the retinotectal projection pattern (green fluorescence) as defined in isl2b:GFP transgenic embryos (B, D, F, H). The mismatch control injected morpholinos resembled the un-injected controls and are not shown. In B, D, F, H, white arrow demarcates the terminal field of the retinal ganglion cells in the optic tectum and the white arrowhead demarcates axonal fibers of the optic nerve. MO, morpholino. Asterisk demarcates the region of trigeminal ganglion. PHENOTYPE:
|
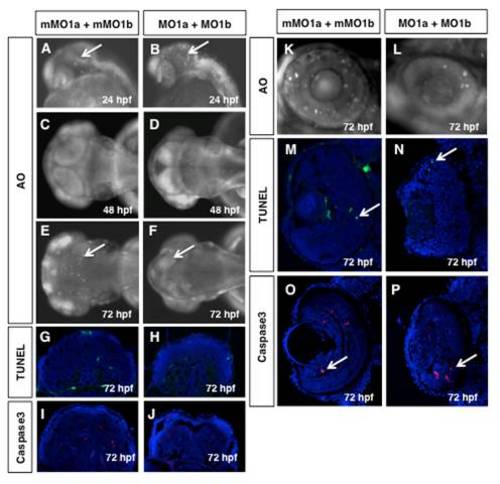
Cell death does not persist in dmbx1 morphant embryos. Live embryos at 24 hpf (A, B, lateral view anterior to the left), 48 hpf (C, D, dorsal view anterior to the left) and 72 hpf (E, F, dorsal view anterior to the left; K, L, close up of retina lateral view dorsal to the top) were examined for the presence of apoptotic cells using AO. Arrows point to AO+ cells in the midbrain (bright spots). TUNEL+ cells (green) or Caspase3+ cells (red) on cryosectioned tissue of 72 hpf midbrains (G-J) and retina (M-P, arrow pointing to labelled cell) counter-stained with DAPI (blue). (MO, morpholino; mMO, mismatch morpholino; hpf, hours post-fertilization; AO, acridine orange. |
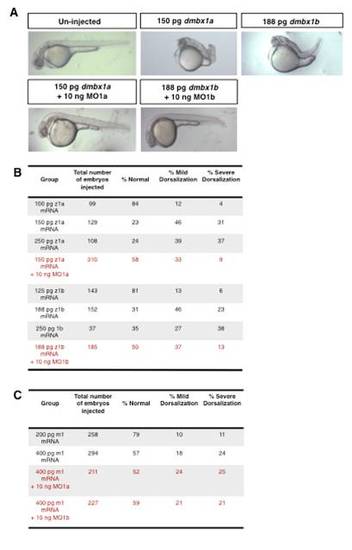
Zebrafish, but not mouse, Dmbx1 mRNA counteracts the zebrafish knockdown phenotype. (A) Representative images of single embryos, lateral view anterior to the left from the different groups analyzed for a dorsalization phenotype. Embryos were injected with the mRNA concentrations shown, co-injected with 10 ng of either MO1a or MO1b as indicated, and scored for a dorsalized phenotype at 24 hpf. Tabulated results for all groups from 2-5 separate experiments using (B) zebrafish mRNA, or (C) mouse mRNA. MO, morpholino; hpf, hours post-fertilization. |

Partial rescue of dmbx1a morphant with dmbx1b mRNA. (A) Un-injected and (B) MO1a injected embryos showing foxb1.2 expression at 48 hpf. Note, the data in these two panels are identical to panels (A) and (B) shown in Figure 9; they were duplicated here for ease of reference. Representative images of embryos co-injected with MO1a and either dmbx1a mRNA (C) or dmbx1b mRNA (D). Dorsal view of embryos, anterior to the top. Black arrows in all panels point to the anterolateral hindbrain region where foxb1.2 is normally expressed. White arrows in all panels point to the dorsal midbrain. MO, morpholino. |

Monitoring mouse Myc-Dmbx1 and zebrafish Myc-dmbx1a levels in vivo. Representative images of an (A) un-injected, (B) mouse myc-Dmbx1 mRNA injected (400 pg), and (C) zebrafish myc-dmbx1a mRNA injected (150 pg) tailbud stage embryo (lateral view) processed for whole-mount immunolabeling using an anti-Myc antibody (n = 10 per group). Panels D-F are representative high magnification images of embryos in each of the three treatment groups; black arrows indicate nuclei that are DAB+ in the injected groups, but lack DAB staining in the un-injected group. |