
- Title
-
Moesin1 and Ve-cadherin are required in endothelial cells during in vivo tubulogenesis
- Authors
- Wang, Y., Kaiser, M.S., Larson, J.D., Nasevicius, A., Clark, K.J., Wadman, S.A., Roberg-Perez, S.E., Ekker, S.C., Hackett, P.B., McGrail, M., and Essner, J.J.
- Source
- Full text @ Development
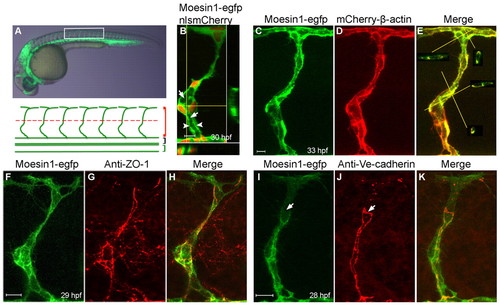
Moesin1-EGFP and mCherry-β-Actin fusion proteins are enriched at apical membranes and cellular junctions. (A) A 30 hpf zebrafish embryo from Tg(flk1:moesin1-egfp) with the box indicating the area shown beneath. Red, black and green brackets indicate the intersegmental vessels (ISVs), dorsal aorta (DA) and posterior caudal vein (PCV), respectively. The red dashed line designates the boundary between the dorsal (top) or ventral (bottom) ISVs. (B) An ISV in a Tg(flk1:moesin1-egfp)/Tg(flk1:nlsmCherry) embryo showing the primary lumen (arrows) forming at 30 hpf. Moesin1-EGFP is enriched at the apical membrane (arrowheads). The nuclei are in red. Virtual cross-sections are at the bottom and to the right of the main panel. Yellow lines designate the planes of the cross-sections. (C-E)A Tg(flk1:moesin1-egfp)/Tg(flk1:mCherry-β-actin) embryo at 33 hpf displayed considerable overlap of fluorescence in the ISV. Virtual cross-sections in E show the lumen. (F-H) Moesin1-EGFP and the tight junction protein ZO-1 co-localized at 29 hpf. (I-K) At 28 hpf, Moesin1-EGFP is enriched at adherens junctions, as labeled with anti-Ve-cadherin antibody, although not always (arrows). (A-K) Lateral images, dorsal is up, anterior is to the left. Scale bars: 10 μm in all figures. |
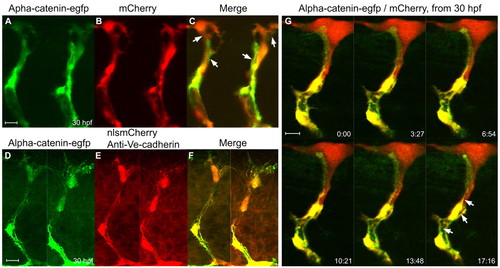
α-Catenin-EGFP localizes to adherens junctions associated with the primary lumen in the ISVs. (A-C) Confocal images of the ISVs in a living Tg(flk1:α-catenin-egfp)/Tg(flk1:mCherry) zebrafish embryo at 30 hpf. Arrows in C point to long putative adherens junctions between cells. (D-F) Labeling of adherens junctions in the ISVs with anti-Ve-cadherin antibody in a Tg(flk1:α-catenin-egfp)/Tg(flk1:nlsmCherry) double-transgenic embryo. (G) Time-lapse confocal images of an ISV in a Tg(flk1:α-catenin-egfp)/Tg(flk1:mCherry) embryo showing the putative primary lumen (arrows) forming between the cellular junctions. The time format is minutes:seconds. EXPRESSION / LABELING:
|

Vacuoles fuse with luminal membranes during initial lumen expansion. (A) An ISV from a living Tg(flk1:moesin1-egfp)/Tg(flk1:nlsmCherry) zebrafish embryo with the box indicating the area shown in B. (B) Time-lapse confocal images showing formation of primary lumen in an ISV with the integration of vacuoles (arrows) from 30 hpf. (C,D) A dorsal ISV from a living Tg(flk1:moesin1-egfp)/Tg(flk1:nlsmCherry) embryo injected intravenously with labeled dextran (D) showing the intracellular vacuoles without labeled dextran (C, arrows). The time is in minutes:seconds. n, nucleus. EXPRESSION / LABELING:
|
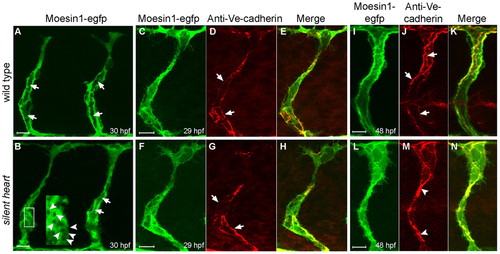
Primary endothelial lumen formation in the ISVs does not require blood flow. (A,B) Formation of the primary lumen (arrows) at 30 hpf is observed with the Tg(flk1:moesin1-egfp) line in either wild-type (A) or silent heart mutants (B). (B) silent heart embryos also displayed vacuoles during tubulogenesis (arrowheads in inset). (C-H) Ve-cadherin-labeled junctions (arrows) appeared normal at 29 hpf in silent heart mutants. (I-N) At 48 hpf, Ve-cadherin-labeled junctions (arrows) are often clustered in the silent heart embryos (arrowheads), which is likely to reflect the collapse of the primary lumen. |

Moesin1 is required in the endothelial cells for tubulogenesis. (A-F) The Tg(flk1:moesin1-egfp) line partially rescues the Moesin1 knockdown phenotype. (A,B) A Tg(flk1:moesin1-egfp) zebrafish embryo injected with 4 ng control MO. All the ISVs were perfused with tetramethylrhodamine-dextran (TMRD, red). (C,D) Wild-type sibling embryo injected with 4 ng moesin1 MO. Most ISVs are not perfused with TMRD, although circulation of TMRD is observed in the axial vessels. (E,F) A Tg(flk1:moesin1-egfp) embryo injected with 4 ng moesin1 MO. Most ISVs are perfused with TMRD. (G-I) Same experiment as in A-F in Tg(flk1:moesin1-egfp)/Tg(flk1:nlsmCherry) embryos shows that the endothelial cells are present in the ISVs despite a lack of circulation at 54 hpf. (J-O) Transplantation of endothelial cells was used to determine autonomous verses non-autonomous effects. (J-L) Normal endothelial tubulogenesis occurs when the donor embryo was injected with control MO. (M-O) Transplanted endothelial cells from Moesin1 knockdown embryos fail to undergo normal tubulogenesis (arrowheads), whereas the ISV in the recipient embryo (arrow) completes lumen formation. |

Moesin1 is required during ISVs tubulogenesis. (A-D) Confocal images of ISVs from Tg(flk1:mCherry-β-actin) living zebrafish embryos. (A,C) Embryos injected with 4 ng control MO. The lumen (arrows) is seen at 30 hpf (A) and is well formed at 54 hpf (C). (B,D) Embryos injected with 4 ng moesin1 MO. The primary lumen is not observed at 32 hpf (B), nor at 54 hpf (D), although a few putative vacuoles or intercellular spaces are observed (B, arrowheads). (E,F) Confocal time-lapse images of wild-type and Moesin1 knockdown Tg(flk1:mCherry-β-actin) embryos. The time format is minutes:seconds. (E) In wild-type embryos, formation of the primary lumen is observed (arrows) at 30 hpf. (F) In Moesin1 knockdown embryos, mCherry-β-Actin remains throughout the cytoplasm and the primary lumen is not observed at 33 hpf. n, nucleus. |

Knockdown of Moesin1 results in extensive loss of adherens junctions without affecting ZO-1-associated junctions. (A-F) Confocal images of ISVs in the Tg(fli1:egfp)y1 zebrafish embryos that were probed for ZO-1 (red) at 54 hpf. (A-C) ZO-1-associated junctions are seen in a control embryo. (D-F) The ZO-1-associated junctions (arrow) are observed in Moesin1 knockdown embryos but are not well separated from one another. (G-L) Confocal images of ISVs in Tg(fli1:egfp)y1 embryos labeled with Ve-cadherin (red) at 54 hpf. (G-I) Ve-cadherin labeling in a control embryo. (J-L) Moesin1 knockdown causes an extensive loss of Ve-cadherin labeling (arrowheads); some weak Ve-cadherin signals are observed (arrows). |
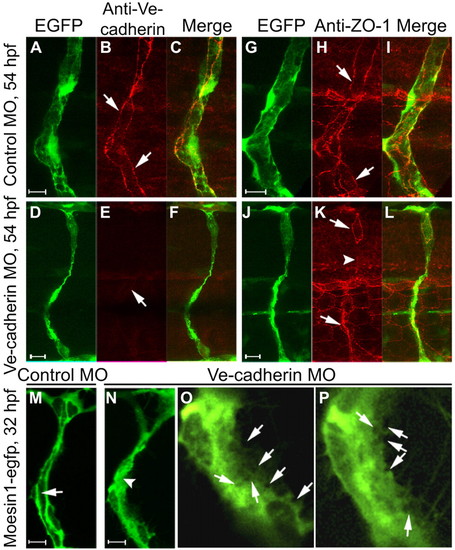
Knockdown of Ve-cadherin impairs lumen formation. (A-F) Confocal images of ISVs in Tg(fli1:egfp)y1 zebrafish embryos probed for Ve-cadherin (red) at 54 hpf. Ve-cadherin labeling (arrows) is observed in control embryos (A-C), but not in Ve-cadherin knockdown embryos (D-F). (G-L) Confocal images of ISVs in Tg(fli1:egfp)y1 embryos labeled with ZO-1 antibody (red) at 54 hpf. ZO-1-associated junctions (arrows) are observed in control embryos (G-I), but are not detected in some regions of the ISV (arrowhead) in a Ve-cadherin knockdown embryo (J-L). (M-P) Confocal images of ISVs in Tg(flk1:moesin1-egfp) embryos at 32 hpf. The primary lumen (arrow) is forming in a control embryo (M). Putative vacuoles or intercellular spaces (arrows in the higher magnification images O and P) are observed throughout the cytoplasm in endothelial cells in Ve-cadherin knockdown embryos (N-P), without formation of primary lumen (N, arrowhead). |
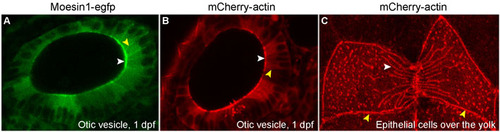
Moesin1-EGFP and mCherry-β-Actin fusion proteins are localized to the apical membranes and cellular junctions in epithelial cells. RNA encoding Moesin1-EGFP and mCherry-β-Actin was injected into 1-cell stage zebrafish embryos. Localization of the fusion proteins was followed in living embryos. (A,B) Moesin1-EGFP and mCherry-β-Actin both localize to the apical membranes (white arrowheads) and cellular junctions (yellow arrowheads) in epithelial cells in the otic vesicle. (C) mCherry-β-Actin fusion proteins incorporate into the presumptive Actin fibers (white arrowhead) and localize to the presumptive cellular junctions (yellow arrowheads) in epithelial cells in the periderm. |

Comparison of the ability to detect the primary lumen between Tg(fli1:egfp)y1 embryos and Tg(flk1:moesin1-egfp) embryos. (A) Western blots were performed as described (Link et al., 2006) using 30 hpf embryos. Western blot analysis of the Moesin1-EGFP fusion protein. (B,D) At 28 hpf, vacuoles contributing to the formation of the primary lumen (arrow) are clearly visible in the Tg(flk1:moesin1-egfp) but not the Tg(fli1:egfp)y1 line. (C,E) At 36 hpf, the primary lumen in the ISVs (arrows) is observed in both lines. |
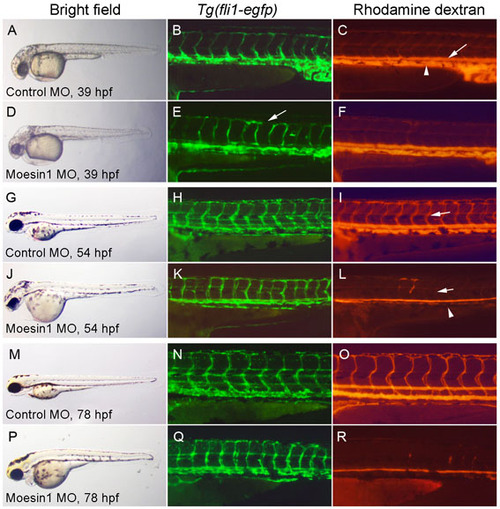
Moesin1 is required for perfusion of the ISVs as a result of defects in tube formation.Tg(fli1:egfp)y1 embryos injected intravascularly with Rhodamine-dextran (TMRD) in order to assess vascular perfusion. Bright-field (A,D,G,J,M,P), EGFP fluorescence (B,E,H,K,N,Q) and microangiography (c,f,i,l,o,r) images are shown. (A-F) Embryos were injected with 4 ng control MO (a-c) or 4 ng of moesin1 MO (d-f) at the 1- to 2-cell stage and processed for microangiography at 39 hpf. At 39 hpf, the EGFP-expressing ISV endothelial cells finished migration in both control and Moesin1 knockdown embryos. Minor disorganization is observed in some of the ISVs, with endothelial cells failing to make contacts with one another in the dorsal longitudinal anastomotic vessel (arrow in E). The axial vessels, comprising the dorsal aorta (arrowhead in C) and the posterior cardinal vein (arrow in C), show perfusion with TMRD under both conditions. (g-l) At 54 hpf, control MO-injected embryos (g-i) display perfusion in both the axial vessels and ISVs in the trunk. By contrast, embryos injected with 4 ng moesin1 MO (j-l) fail to perfuse TMRD in most of the ISVs and axial circulation is reduced. Examination of the endothelial cells in the ISVs labeled with EGFP showed they were present and in the proper locations. Taken together, these observations suggest that knockdown of Moesin1 leads to defects in endothelial tubulogenesis. (m-r) Defects in perfusion of the ISVs are still observed at 78 hpf after knockdown of Moesin1 (p-r), while the endothelial cells persisted. Normal vascular perfusion is observed after injection of control MO (M-O), indicating that the defects in vascular perfusion are not a result of developmental delay in the embryo. |

Moesin1 knockdown embryos display dose-dependent MO-induced defects in vascular perfusion. Ten embryos per group injected with TMRD at 54 hpf were scored for vascular perfusion for each experiment. Results are shown for one out of three similar experiments. (A) The percentage of embryos showing normal circulation in the dorsal aorta and posterior cardinal vein. A dose-dependent reduction of axial circulation is observed after injection of the moesin1 MO. (B) The percentage of embryos displaying either normal, partial (L-M, low to medium: 5-50% ISVs have no blood circulation), partial (M-S, medium to strong: 50-90% ISVs have no blood circulation), or no circulation (>90% ISVs have no blood circulation) in the ISVs after injection of either a control or moesin1 MO. The moesin1 MO was injected at 2, 4 and 6 ng and displays dose dependence for producing defects in circulation. (C) Western blot analysis of Moesin1 using an anti-Moesin antibody (BD Biosciences) following injection of either a control or moesin1 MO. Three embryos at 30 hpf were loaded per lane. The blot was reprobed with a mouse anti-β-Actin antibody (Sigma) as a loading control. Moesin1 MO dramatically reduces the level of Moesin1 protein. |
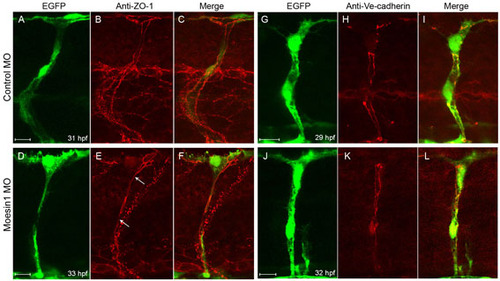
Knockdown of Moesin1 results in partial loss of adherens junctions without affecting ZO-1-associated junctions between endothelial cells in the ISVs. (A-F) Confocal images of the ISVs in Tg(fli1:egfp)y1 embryos that were probed for ZO-1 (red) at 34 hpf and 36 hpf. (A-C) In control MO-injected embryos, two ZO-1-associated junctions that run lengthwise along the ISV are detected. (D-F) In Moesin1 knockdown embryos, the ZO-1-associated tight junctions are observed along the length of the ISV (arrow), but the junctions are not separated from one another as in the control embryos. (G-L) Confocal images of the ISVs from Tg(fli1:egfp)y1 embryos are labeled with Ve-cadherin (red) at 29 hpf and 32 hpf. (G-I) Two strands of Ve-cadherin labeling that run lengthwise along the ISV are observed in control embryos. (j-l) Moesin1 knockdown causes partial loss of Ve-cadherin labeling (arrow), with junctions between cells appearing as beads (arrowhead) on a string rather than a continuous junction. (a-l) Lateral images, dorsal is up, anterior is to the left. Scale bars: 10 μm. |

Knockdown of Ve-cadherin using a splice-directed MO. (A) Intron/exon structure between exon 8 and exon 11 in the ve-cadherin gene showing the location of the morpholino and the RT-PCR primers (P1-P5) used for molecular confirmation. (B) RT-PCR results. Wild-type embryos are designated with a 0. RT-PCR reactions from embryos injected with 10 ng of the ve-cadherin MO are labeled with a 10. Each lane represents one embryo (1 dpf). P1/P2 primers were used as a control and amplify a similar product (148 bp) for all conditions. P3/P4 primers amplify an expected product for a properly spliced ve-cadherin transcript in wild-type embryos (347 bp). By contrast, RT-PCR from embryos injected with the ve-cadherin MO amplifies two aberrant splicing products (alternative splicing 1 and 2 in C; 104 bp and 301 bp, respectively). P5/P4 primers amplify an RT-PCR product of the expected size from wild-type embryos (112 bp). In embryos injected with 10 ng of the ve-cadherin MO, a smaller RT-PCR product (66 bp) is observed. (C) The effect of ve-cadherin MO on ve-cadherin splicing. The ve-cadherin MO caused two alternative splicing products. Alternative splicing 1 results in complete loss of exon 10 and the following exons. Alternative splicing 2 causes partial loss of exon 10 and complete loss of the following exons because of a cryptic splice site within exon 10. PCR product sequences were confirmed by sequence analysis. Primers used in PCR analysis of ve-cadherin splicing products were as follows: P1, 5′-agcctgaaggttctggacat-3′; P2, 5′-gtaaagcgaaacctgcctga-3′; P3, 5′-caggcaggtttcgctttact-3′; P4, 5′-ctttttgatagcgccgtctc-3′; and P5, 5′-gtcctacgcaaggactggaa-3′. |

Ve-cadherin is required for endothelial tubulogenesis in the ISVs. Confocal images of the ISVs from Tg(fli1:egfp)y1 transgenic recipient embryos at 54 hpf transplanted with cells from a double EGFP- and RFP-expressing Tg(fli1:egfp)y1/Tg(β-actin:rfp) donor embryo. Lateral images of living embryos, dorsal is up, anterior is to the left. (A-C) Normal endothelial tubulogenesis in a donor embryo injected with 10 ng of the control MO. (D-F) Endothelial tube formation was inhibited when the donor embryo was injected with 10 ng of the ve-cadherin MO. Scale bars: 10 μm. |