
- Title
-
Zebrafish ProVEGF-C Expression, Proteolytic Processing and Inhibitory Effect of Unprocessed ProVEGF-C during Fin Regeneration
- Authors
- Khatib, A.M., Lahlil, R., Scamuffa, N., Akimenko, M.A., Ernest, S., Lomri, A., Lalou, C., Seidah, N.G., Villoutreix, B.O., Calvo, F., and Siegfried, G.
- Source
- Full text @ PLoS One
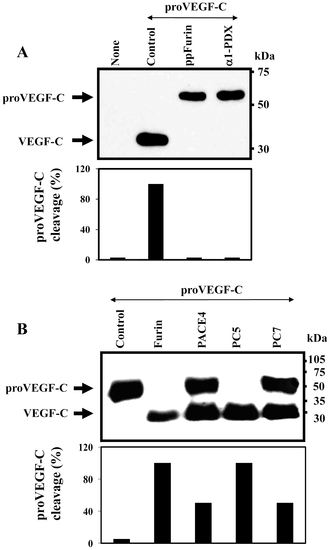
Processing of zebrafish proVEGF-C. (A) Processing of proVEGF-C was analyzed by Western blotting in zebrafish ZF4 cells transiently cotransfected with pSecTagB (Myc tag) vector containing the zebrafish proVEGF-C cDNA and the empty pIRES2-EGFP vector (Control) or pSecTagB expressing proVEGF-C and pIRES2-EGFP containing the PCs inhibitors; ppFurin or α1-PDX. Results of band intensities are shown in the bar graph that were deduced from the ratio of VEGF-C/(pro-VEGF-C + VEGF-C). Results are representative of three experiments. (B) The processing of proVEGF-C was analyzed by Western blotting using anti-Myc antibody on media derived from PCs-deficient LoVo cells transiently cotransfected with either pIRES2-EGFP vector alone and pSecTagB (Myc tag) containing the zebrafish VEGF-C cDNA (Control) or pIRES2-EGFP vector containing Furin, PACE4, PC5 or PC7 cDNA. The corresponding percentages of band intensities were deduced from the ratio of VEGF-C/(proVEGF-C+VEGF-C). Results are representative of three experiments. |
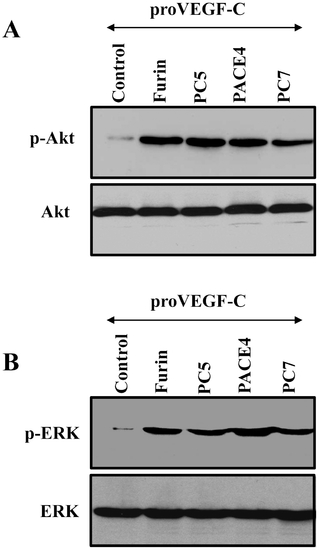
Requirement of the PCs in VEGF-C-mediated Akt and ERK phosphorylation in ZF4 cells. Confluent ZF4 cells were serum starved for 24–48 h and then treated for 2 min at 37°C with media derived from LoVo cells transiently cotransfected with empty vectors and pSecTagB vector containing proVEGF-C construct (Control) or pSecTagB vector containing proVEGF-C cDNA and pIRES2-EGFP vector expressing full-length Furin, PACE4, PC5 or PC7 cDNAs. Equal amounts of cell lysates were subjected to Western blotting using an anti-phospho-Akt (A), or an anti-phospho-ERK (B). The anti-Akt and anti-ERK were used for data normalization. Results are representative of three experiments. |
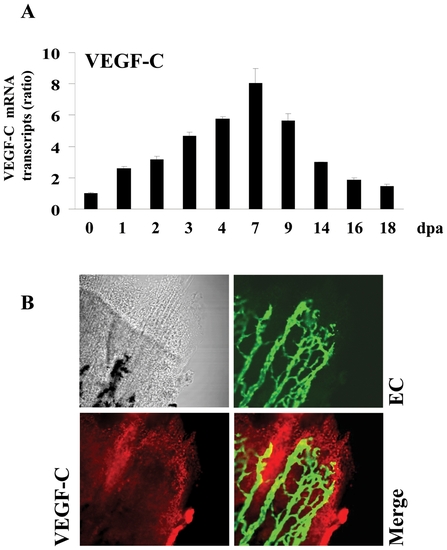
Expression of VEGF-C during fin regeneration. Adult zebrafish were anesthetized in tricaine and fins were cut using razor blades. (A) Total RNA was isolated from fins (15–20 fins per time point) with uncut fin as control (0 dpa) and analyzed by real-time PCR using specific primers for zebrafish VEGF-C or β-actin. Results are shown in the bar graph and are expressed as the ratio of the indicated transcripts relative to control (0 dpa). Results are shown as means ± S.E. of three experiments performed in triplicate. (B) Expression patterns of VEGF-C at 3 dpa were analyzed by immunofluorescence with an anti-VEGF-C (red signal) using fli-EGFP transgenic zebra fish that allows the visualisation of endothelial cells (EC) (green signal). The expression of VEGF-C was mainly localized to the apical growth zone of the regenerating fin (red signal, 25x objective). EXPRESSION / LABELING:
|
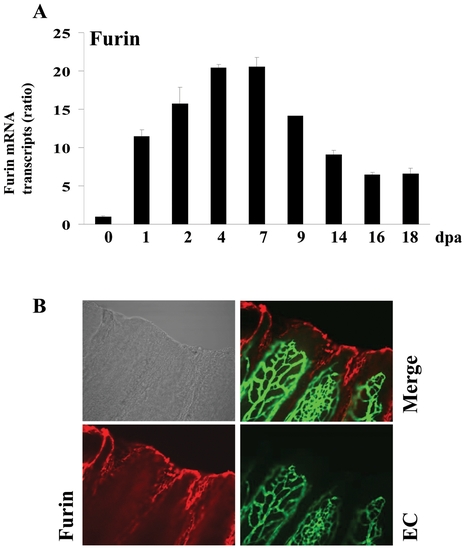
Expression of Furin during fin regeneration. (A) Total RNA was isolated from fins (15–20 fins per time point) and analyzed by real-time PCR using specific primers for zebrafish Furin or β-actin. Results are shown in the bar graph and are expressed as the ratio of the indicated transcripts relative to control (0 dpa). Results are shown as means ± S.E. of three experiments performed in triplicate. (B) Immunofluorescence analysis revealed that Furin is mainly localized to the apical growth zone of the regenerating fin (red signal, 25x objective). EXPRESSION / LABELING:
|

Expression of PC5 during fin regeneration. (A) Total RNA was isolated from fins (15-20 fins per time point) and analyzed by real-time PCR using specific primers for zebrafish PC5 or β-actin. Results are shown in the bar graph and are expressed as the ratio of the indicated transcripts relative to control (0 dpa). Results are shown as means ± S.E. of three experiments performed in triplicate. (B) Immunofluorescence analysis revealed that PC5 is expressed in all area of the regenerating fin and low signal was observed on the vessels (red signal, 25x objective). EXPRESSION / LABELING:
|

Uprocessed ProVEGF-C inhibits VEGF-C-induced ZF4 cells proliferation. (A) ZF4 cells were transiently transfected with empty vector (None), vector containing the wild-type (wt, HSIIRR) or mutated (mut, HSIISS) proVEGF-C cDNA. proVEGF-C processing was analyzed by western blot. Results are representative of three experiments. (B) ZF4 cells were serum deprived overnight and then treated for 24 h with media derived from LoVo cells transiently transfected with empty vectors (Control) or pSecTagB containing wild-type (wt) or mutated (mut) proVEGF-C cDNA. (C) ZF4 cells were serum deprived overnight and then treated or not for 6 h with media derived from LoVo cells transiently transfected with vector containing mut VEGF-C cDNA and incubated for 24 h with media derived from LoVo cells transfected with vector containing wt proVEGF-C cDNA. Cell proliferation was evaluated using the Cell Titer96 non-radioactive cell proliferation assay. Data are shown as means ± S.E. of three experiments performed in triplicate. *p<0.005; **p<0.0001. |
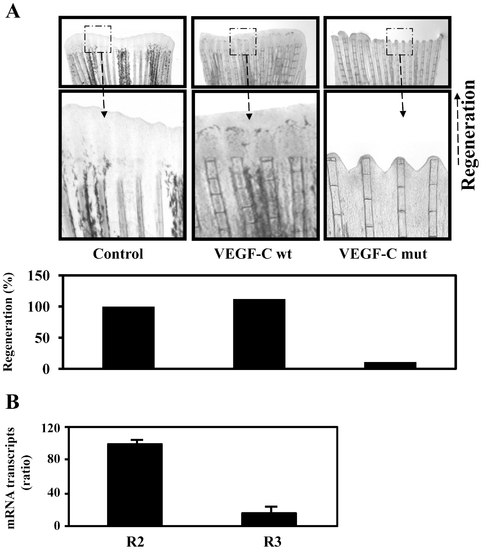
Uprocessed ProVEGF-C inhibits fin regeneration. (A) 24 h prior amputation of caudal fins (6 per group), empty vector (Control) or vector containing wild-type (wt) or mutant (mut) proVEGF-C constructs were injected in the fins and animals were allowed to regenerate at 28.5°C after fins amputation for 5 days. The microinjection of vector containing wild-type proVEGF-C had no effect on normal regeneration. In contrast, injection of the mutant proVEGF-C resulted in severe inhibition of fin regeneration. Results are representative of tree experiments. The corresponding percentages of regenerated area were deduced from the ratio of 100 x (fin surface regenerated in VEGF-Cwt)/(fin surface regenerated in Control) and 100 x (fin surface regenerated in VEGF-Cmut/fin surface regenerated in Control). (B) Total RNA derived from uncut fins was subjected to real-time PCR analysis using specific primers for the VEGF-C receptors R2, R3 or β-actin. During PCR, the transcription of β-actin that was evaluated in each sample was used as endogenous control. Results are shown in the bar graph and are expressed as the ratio of the indicated transcripts relative to R2 transcript assigned to 100%. Results are shown as means ± S.E. of three experiments performed in duplicate. |